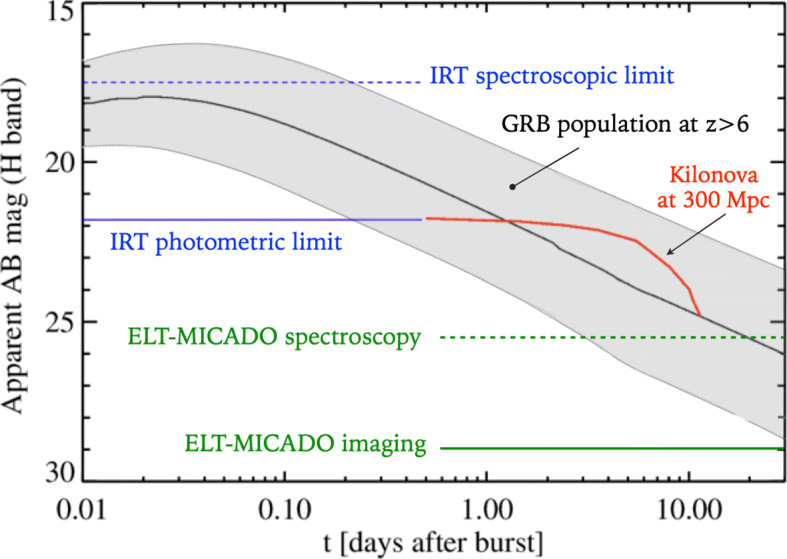
Fig. 3.

Expected H-band light curves of the afterglow of high redshift GRBs and a kilonova from NS-NS merger at 300 Mpc. The shaded area indicates the median (black line) and 1-σ scatter of 100 simulated light curves drawn from GRB population models at z > 6 following [11]. The red curve represents the kilonova associated to GW170817, projected to a distance of 300 Mpc, using H-band photometry from [12]. Horizontal lines indicate the limiting magnitude of THESEUS IRT (600s and 1800s exposure for photometric and spectroscopic limit, with SNR= 5 and 3, respectively,) and ESO ELT-MICADO (1 h exposure with SNR = 5) in imaging and spectroscopic mode respectively (re-adapted from [13])
