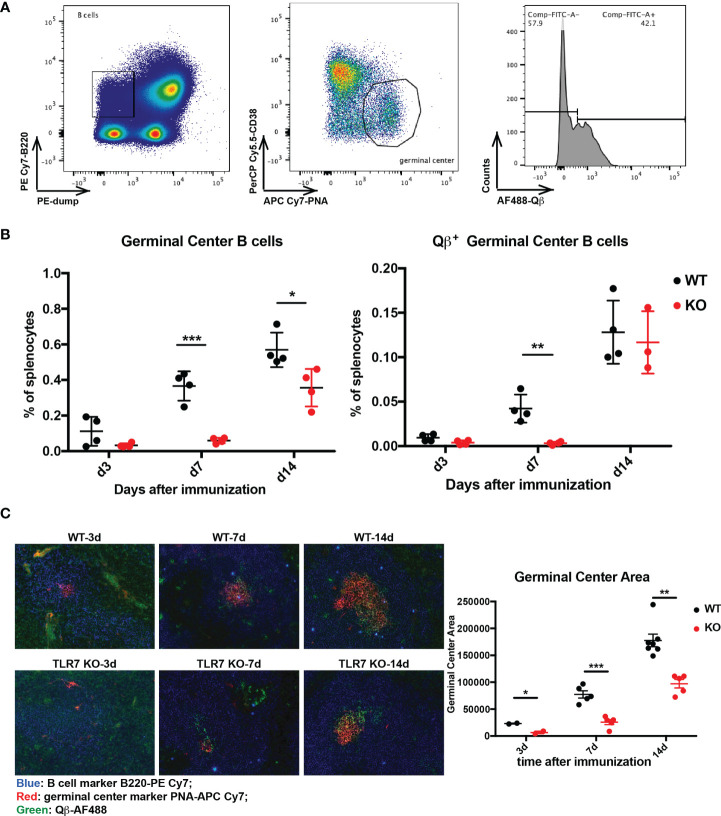
Figure 1.
Examination of Qβ-specific germinal center reaction. (A) gating strategy to measure germinal center B cells and Qβ-specific cells by flow cytometry. B cells were defined as B220high dump (CD4, CD8, IgM, IgD, CD11b, CD11c, GR1)low, from which PNAhigh CD38low germinal center cells were selected. Then Qβhigh cells from germinal center cells were marked. (B) Percentage of germinal center cells (left) and Qβ+ germinal center B cells (right) in splenocytes were plotted (n = 4). (C) Immuno-histology of Qβ-specific germinal centers of spleen sections from WT and TLR7 KO mice during 14 days after Qβ immunization. B cells were labeled as B220 (blue), germinal center as PNA (red) and Qβ (green). Analysis of germinal center areas with Image J 1.51s. p value from unpaired t-test was indicated as ≤0.05 (*), ≤0.01 (**), ≤0.001 (***). The figure is representative of two independent experiments.

