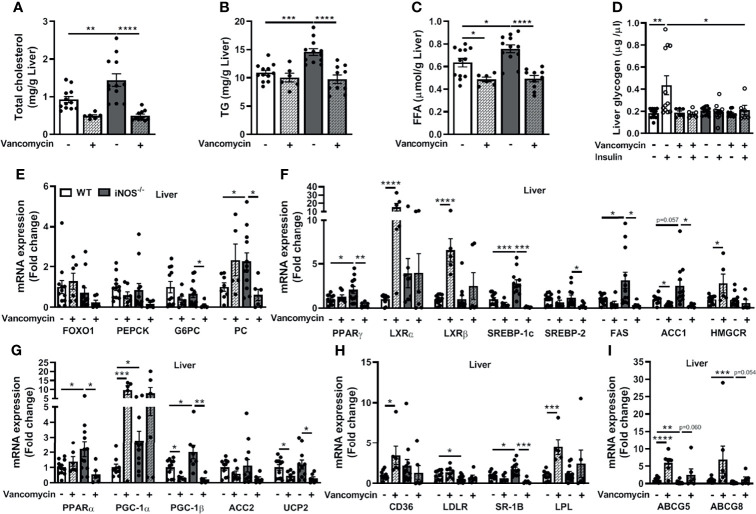
Figure 4.
Improvement in the disrupted lipid and glucose homeostasis in the liver in iNOS−/− mice following treatment with vancomycin. Hepatic lipid levels in WT and iNOS−/− mice with and without vancomycin treatment: (A) TC, (B) TG, and (C) FFA. (D) Hepatic glycogen levels with or without insulin stimulation in WT and iNOS−/− mice with and without vancomycin treatment. Hepatic mRNA expression analysis of genes involved in (E) gluconeogenesis, (F) lipid synthesis, (G) lipid oxidation, (H) lipid uptake, and (I) lipid efflux. Data are represented as mean ± SEM (n ≥ 6). *p < 0.05, **p < 0.01, ***p < 0.001, ****p < 0.0001 between indicated groups. See also Figure S7 .

