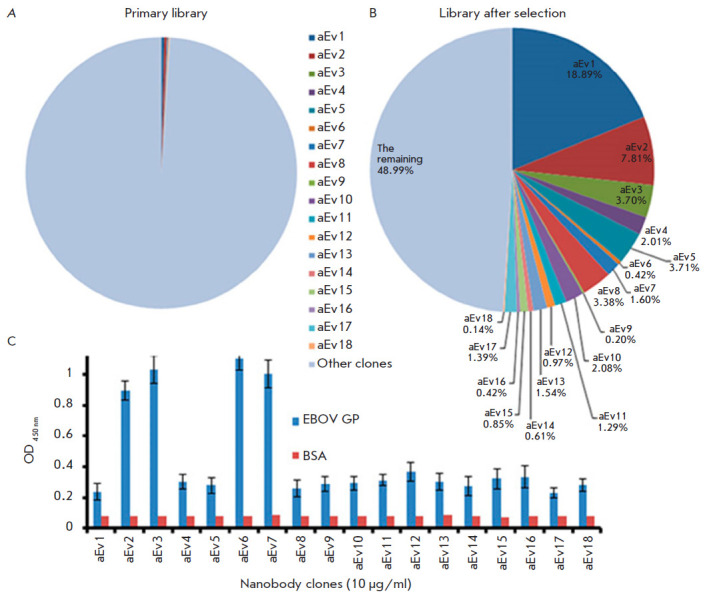
Fig. 2.

Comparative analysis of the percentage of nanobodies in the primary library before and after selection. (A) – percentage of nanobodies in the primary library. (B) – percentage of nanobodies in the library after selection. (C) – Screening of 18 nanobody clones by indirect ELISA. aEv1–18 – nanobody clones, EBOV GP – recombinant EBOV GP, BSA – bovine serum albumin (negative control)
