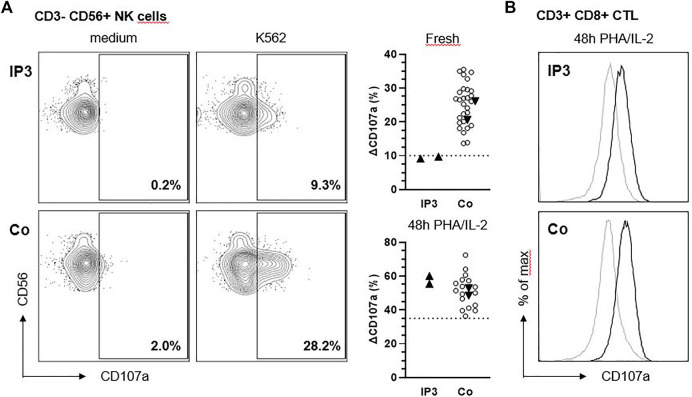
FIGURE 3.
NK cell degranulation of IP3 is slightly reduced in response to K562. (A) Ex vivo degranulation of CD3− CD56+ NK cells from IP3 and a healthy day control (Co.) after incubation with medium (left panel) or NK-sensitive K562 target cells (middle panel) assessed by flow cytometric analysis of CD107a surface expression. Graphs in the right panel show ∆CD107a for the patient and healthy day controls (solid triangles) pooled from two independent experiments assessing fresh and activated (PHA/IL-2 pre-culture for 48 h) NK cell degranulation. ∆CD107a was calculated as the percentage of NK cells expressing CD107a after stimulation with K562 minus the percentage of NK cells expressing CD107a after incubation with medium. Blank circles represent historical controls (n = 28,17). The dashed line indicates the diagnostic cutoff below which NK cell degranulation is considered abnormal and equals the 10th percentile of a reference range. (B) Degranulation of CD3+ CD8+ CTL after incubation with medium (grey line) or anti-CD3/CD28 beads (black line).

