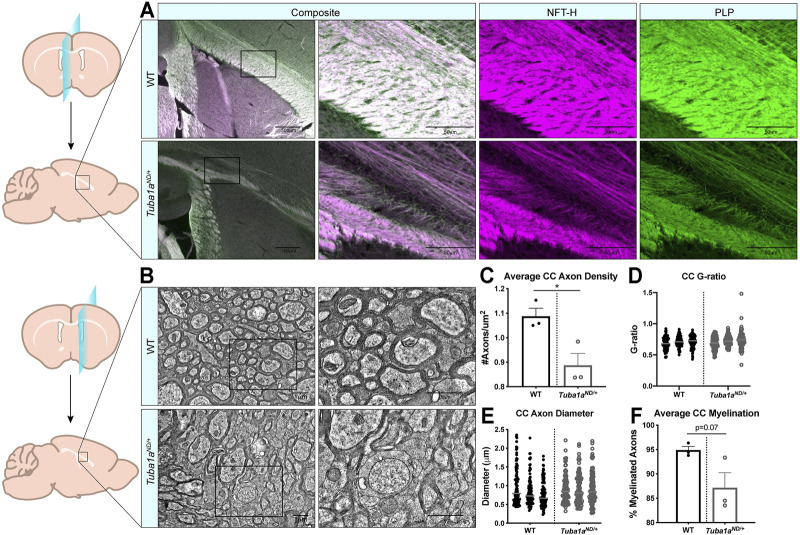
FIGURE 4.
Axon density is reduced by Tuba1a ND/+ in midline corpus callosum. (A) Sagittal brain sections at midline from wild-type (top) and Tuba1a ND/+ (bottom) brains stained with neurofilament-heavy (NFT-H; magenta) to label axons, and proteolipid protein (PLP; green) to label myelin. Images were taken at ×4 (left) and ×20 (right) magnification with 500 and 50 μm scale bars, respectively. (B) Electron microscopy (EM) images of sagittal wild-type (top) and Tuba1a ND/+ (bottom) sections of corpus callosum 2 mm adjacent to midline. Enlarged regions on right are denoted by boxes, scale bar is 1 μm. (C) Scatter plot representing axon density of wild-type and Tuba1a ND/+ axons in analyzed EM images. Data points represent average values for each animal (n = 6 regions containing same total area; p = 0.03). (D) Scatter plot of G-ratio measurements for wild-type and Tuba1a ND/+ axons. Data points represent individual myelinated axons and are clustered by animal (N = 3 mice, n = 100 axons; p = 0.34). (E) Scatter plot of axon diameters in wild-type and Tuba1a ND/+ corpus callosum by EM. Only those axons captured in cross section were assessed for diameter, as skewed axons provide inaccurate measurements. Data points represent individual axons and are clustered by animal (n = 100; p = 0.14). (F) Scatter plot representing the average percent of myelinated axons per animal in wild-type and Tuba1a ND/+ corpus callosum. Six regions containing the same total area were assessed (n = 6; p = 0.07). Statistical differences between means of wild-type and Tuba1a ND/+ datasets were assessed by t test, with *p < 0.05.

