FIGURE 7.
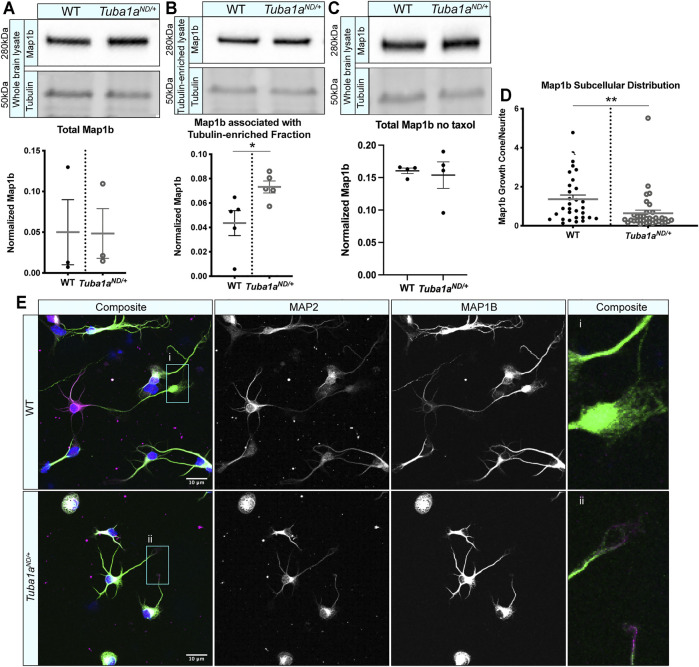
Tuba1a ND neurons do not correctly localize Map1b to the developing growth cone. (A) Western blot showing total Map1b protein in whole brain lysate from wild-type (WT) and Tuba1a ND/+ mice. Scatter plot representing total Map1b protein in brain lysate by western blot, normalized to the total protein on a stain-free blot. p = 0.98 by t-test. (B) Western blots showing Map1b protein associated with a taxol stabilized tubulin-enriched fraction from brain (top panel). Due to the amount of protein that was loaded for Map1b western blots, antibody-stained bands for α-tubulin were oversaturated and could not be quantified, thus Map1b was normalized to the 50 kDa band (presumed to be primarily tubulin) on a UV-activated stain-free blot (bottom panel). Scatter plot quantifying Map1b associated with the taxol-stabilized tubulin-enriched brain lysate, normalized to the 50 kDa presumed tubulin band using stain-free western blotting. p = 0.03 by t-test (C). Western blot showing Map1b from WT and Tuba1a ND/+ pellet fraction of brain lysates without the addition of taxol. Scatter plot quantifying Map1b associated with tubulin enriched from brain lysates shows no significant difference between the amount of Map1b associated with tubulin when no taxol was added, p = 0.76 by t-test. Map1b is normalized to the 50 kDa tubulin band using stain-free western blotting. (D) Scatter plot showing the subcellular distribution of Map1b protein in WT and Tuba1a ND/+ cortical neurons at DIV 3. Data are represented as Map1b fluorescent signal in growth cone region divided by a region proximal to the cell body of the same area. Fluorescent images were acquired using identical microscope imaging settings between samples and were not post-processed to adjust fluorescence prior to quantification. p = 0.009. (E) Representative images showing altered subcellular distribution of Map1b in Tuba1a ND/+ (bottom) cortical neurons compared to WT (top) at DIV 3. Composite and individual channel grayscale images of MAP2 and Map1b immunocytochemistry are shown, i and ii indicate enlarged regions shown in insets. Scale bars are 10 m. Differences between groups were evaluated by t test. *p < 0.05; **p < 0.01.

