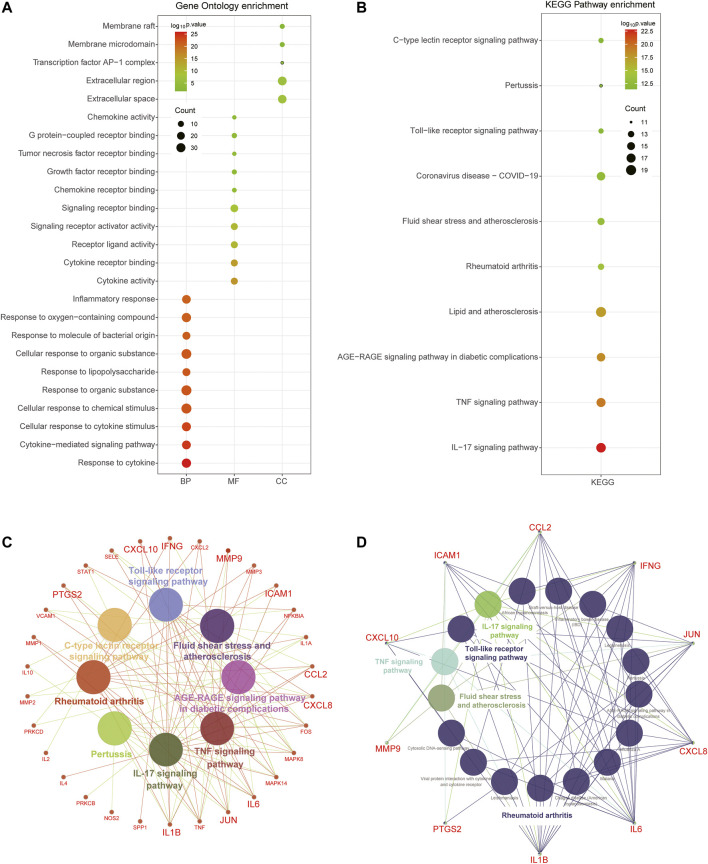
FIGURE 3.
Functional enrichment analysis of total RA-related targets. (A) Bubble diagram showing the results of GO enrichment analysis, including top 10 terms in BP, MF, and CC, respectively. (B) Top 10 pathways of KEGG enrichment analysis were associated with immune activation. (C) The network showing the detailed genes involved in the top 10 pathways and the hub targets were enlarged. (D) The network showing the KEGG pathways enrichment of 10 hub targets.

