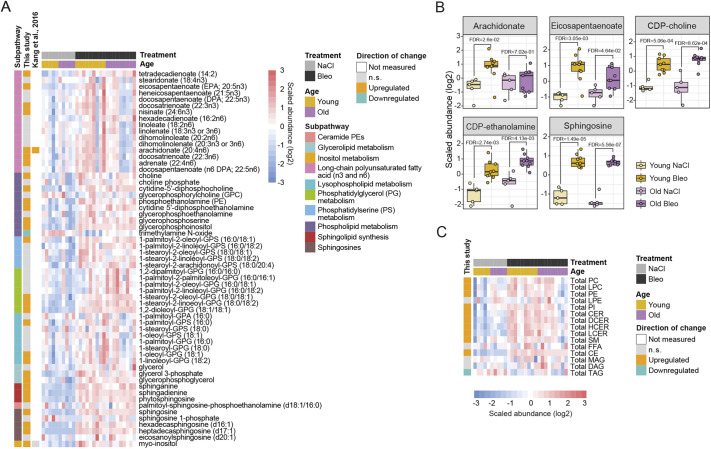
Fig. 4.
Tissue turnover and repair lipid signature in bleomycin-treated lungs. (A,B) Heat map (A) and box plots (B) showing log2 scaled abundance of indicated lipids involved in tissue turnover and remodeling in bleomycin-treated and control lungs. In B, the lower and higher hinges represent the first and third quartiles, respectively; the median is indicated by the intermediate bar. The whiskers extend up to 1.5 times the interquartile range from each hinge; more distant data points are displayed as outliers. (C) Heat map showing log2 scaled abundance of total lipid classes in bleomycin-treated and control lungs. FDR<0.05. Up- and downregulated metabolites in heat maps are annotated according to the changes in young mice (fold change and FDR<0.05). Bleo, bleomycin; CDP, cytidine diphosphate; CE, cholesteryl ester; CER, ceramide; DAG, diacylglycerol; DCER, dihydroceramide; FDR, false discovery rate; FFA, free fatty acid; GPA, glycerophosphate; GPC, glycerophosphocholine; GPG, glycerophosphoglycerol; GPS, glycerophosphoserine; HCER, hexosylceramide; LCER, lactosylceramide; LPC, lysophosphatidylcholine; LPE, lysophosphatidylethanolamine; MAG, monoacylglycerol; n.s., not significant; PC, phosphatidylcholine; PE, phosphatidylethanolamine; PI, phosphatidylinositol; SM, sphingomyelin; TAG, triacylglycerol.

