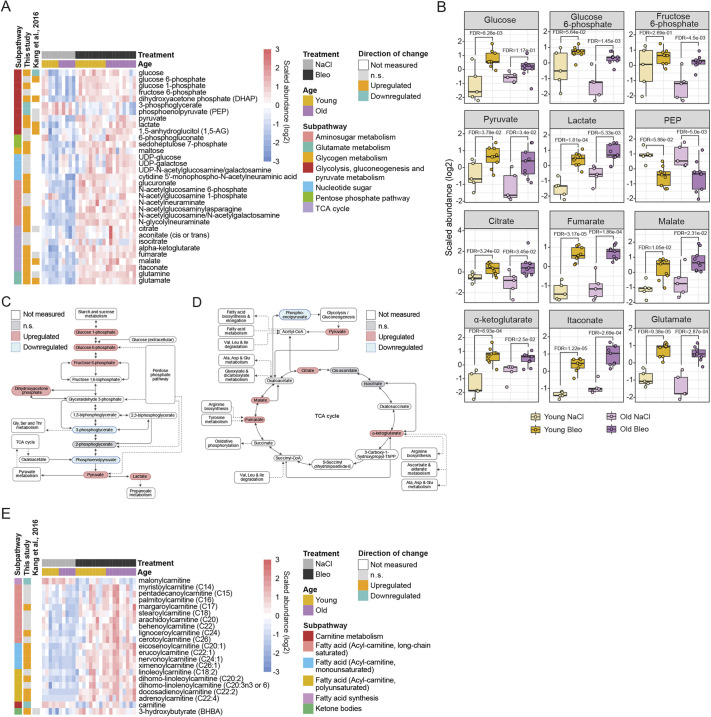
Fig. 5.
Metabolomic reprogramming of energy pathways in bleomycin-treated lungs. (A,B) Heat map (A) and box plots (B) showing log2 scaled abundance of indicated metabolites involved in energy-producing pathways in bleomycin-treated and control lungs. In B, the lower and higher hinges represent the first and third quartiles, respectively; the median is indicated by the intermediate bar. The whiskers extend up to 1.5 times the interquartile range from each hinge; more distant data points are displayed as outliers. (C,D) Simplified scheme of the glycolysis pathway (C) and TCA cycle (D) and the connections to other metabolomic pathways. (E) Heat map showing log2 scaled abundance of indicated fatty acid β-oxidation metabolites in bleomycin-treated and control lungs. Up- and downregulated metabolites in heat maps are annotated according to the changes in young mice (fold change and FDR<0.05). FDR<0.05. Ala, alanine; Asp, aspartate; Bleo, bleomycin; FDR, false discovery rate; Glu, glutamate; Gly, glycine; Ile, isoleucine; Leu, leucine; n.s., not significant; PEP, phosphoenolpyruvate; Ser, serine; TCA, tricarboxylic acid; Thr, threonine; UDP, uridine diphosphate; Val, valine.

