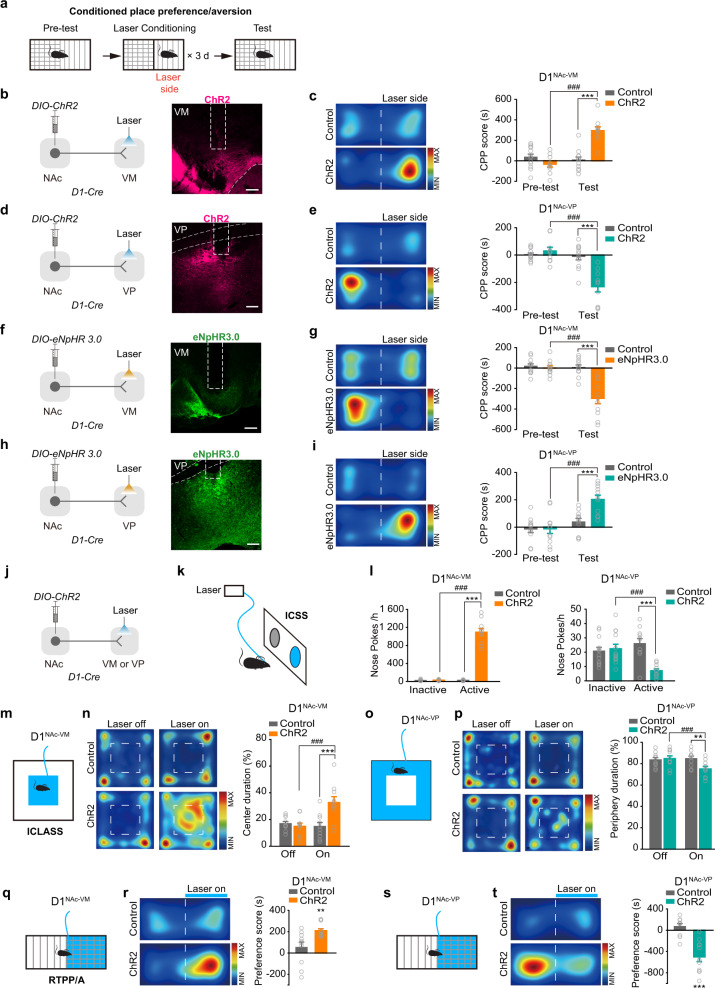
Fig. 2. Activation of D1NAc-VP or D1NAc-VM projections drives opposing emotional responses.
a Schematic of CPP/A task. AAV9-EF1α-DIO-hChR2-mCherry or AAV9-EF1α-DIO-eNpHR3.0-EYFP was injected into the NAc and an optical fiber was implanted over the VM or VP of D1-Cre mice. After three-day laser-paired place conditioning in ChR2 or eNpHR3.0 expressing mice, CPP/A test was performed. b, d, f, h Viral infection and representative images of the optical fiber tip in the VM or VP. c, e, g, i Representative images of locomotor heat maps of Test and bar graphs of CPP score. [Two-way RM ANOVA: c Control n = 12, ChR2 n = 10, Ftreatment×session(1, 43) = 29.361, P < 0.001; e Control n = 12, ChR2 n = 10, Ftreatment×session(1, 43) = 22.372, P < 0.001; g Control n = 11, eNpHR3.0 n = 11, Ftreatment×session(1, 43) = 18.787, P < 0.001; i Control n = 11, eNpHR3.0 n = 11, Ftreatment×session(1, 43) = 7.475, P = 0.013] ***P < 0.001 vs Control, ###P < 0.001 vs Pre-test. j Viral infection. AAV9-EF1α-DIO-hChR2-mCherry was injected into the NAc and an optical fiber was implanted over the VM or VP of D1-Cre mice. k Schematic of ICSS task. Mice received optogenetic self-stimulation of D1NAc-VM or D1NAc-VP projection in response to nose-poke. l Bar graph of nose-pokes for optical stimulation of D1NAc-VM or D1NAc-VP projection. [RM ANOVA with Geisser-Greenhouse correction, D1NAc-VM: Control n = 14, ChR2 n = 10, Fvirus×nosepoke(1, 22) = 215.079, P < 0.001; Two-way RM ANOVA, D1NAc-VP: Control n = 13, ChR2 n = 11, Fvirus×nosepoke(1, 47) = 29.806, P = 0.000017] ***P < 0.001 vs Control, ###P < 0.001 vs Inactive portal. m, o Schematic of ICLASS task. When mice entered the marked area (blue), laser was passed to the VM or VP. n, p Representative locomotor heat maps of ICLASS and bar graph of percentage of duration in the area with laser stimulation. [Two-way RM ANOVA: n Control n = 10, ChR2 n = 10, Ftreatment×session (1, 39) = 10.465, P = 0.005; p Control n = 10, ChR2 n = 10, Ftreatment×session(1, 39) = 9.502, P = 0.006] **P < 0.01, ***P < 0.001 vs Control, ###P < 0.001 vs Off. q, s Schematic of RTPP/A task. When mice entered the marked chamber (blue), laser was passed to the VM or VP. r, t Representative locomotor heat maps of RTPP/A and bar graphs of Preference score. [Two-tailed Student’s t-test: r Control n = 10, ChR2 n = 12 t (20) = −3.127, P = 0.005; Mann-Whitney U test, t Control n = 10, ChR2 n = 11, Z = −3.592, P = 0.000068.] **P < 0.01 and ***P < 0.001.

