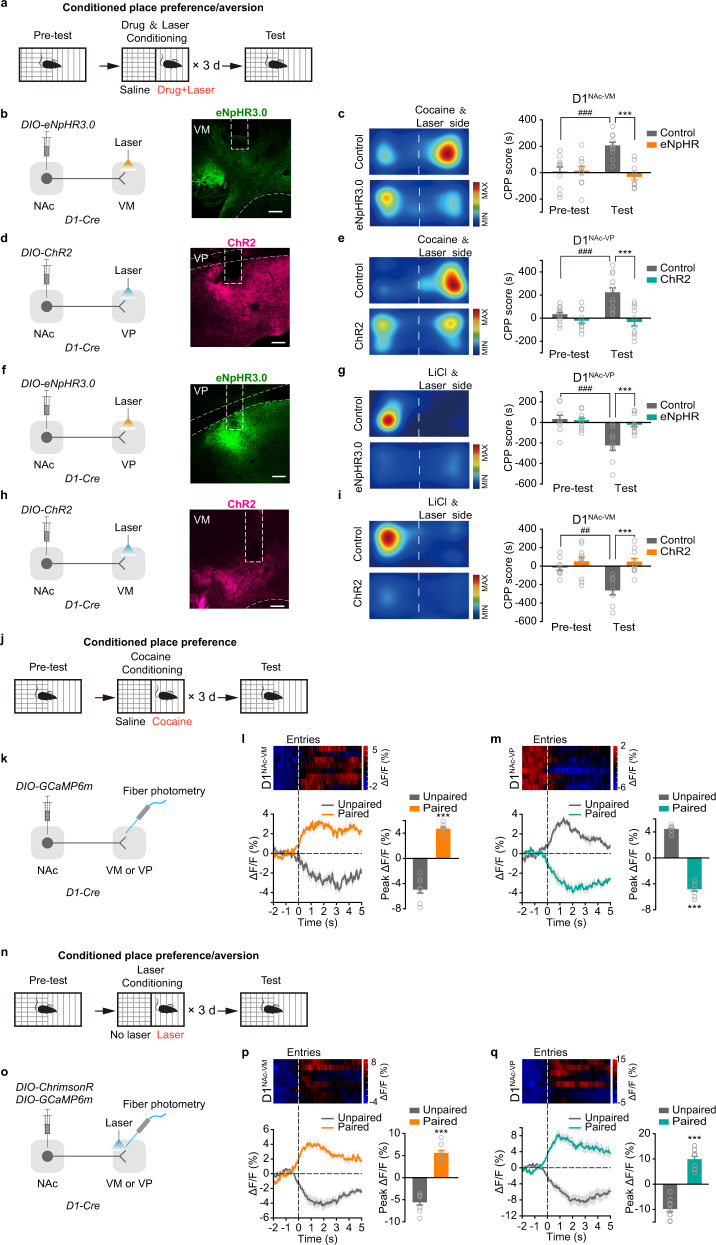
Fig. 3. Activation of D1NAc-VP projection inhibits cocaine CPP and activation of D1NAc-VM projection inhibits LiCl CPA.
a Schematic of experimental design. Laser stimulation was presented during cocaine- or LiCl-place conditioning. After three-day conditioning, the CPP/A test was performed. b, d, f, h Viral infection and representative images. AAV9-EF1α-DIO-hChR2-mCherry, AAV9-EF1α-DIO-mCherry, AAV9-EF1α-DIO-eNpHR3.0-EYFP, or AAV9-EF1α-DIO-EYFP was injected into the NAc of D1-Cre mice, and optical fibers were bilaterally implanted over the VM or VP. Scale bar: 100 μm. c, e, g, i Representative images of locomotor heat maps of Test and bar graphs of CPP score. [Two-way RM ANOVA: c Control n = 10, eNpHR3.0 n = 10, Ftreatment×session(1, 39) = 13.823, P = 0.002; e Control n = 12, ChR2 n = 10, Ftreatment×session(1, 43) = 8.751, P = 0.008; g Control n = 9, eNpHR n = 11, Ftreatment×session(1, 39) = 7.403, P = 0.014; i Control n = 8, ChR2 n = 10, Ftreatment×session(1, 35) = 6.243, P = 0.024] **P < 0.01,***P < 0.001 vs Control, ###P < 0.001 vs Pre-test. j Schematic of experimental design. After three-day cocaine-conditioning, photometry recording of Ca2+ transient of D1NAc-VM and D1NAc-VP projections during CPP test was performed. k Viral infection. AAV9-EF1α-DIO-GCaMP6m was injected into the NAc of D1-Cre mice, with optical fiber implanted over the VM or VP. l, m (Top) Representative heat map of Ca2+ signaling in D1NAc-VM and D1NAc-VP projection during successive entries into cocaine paired side during CPP test. (Bottom) Averaged Ca2+ traces and quantification of peak amplitude of Ca2+ events around entry [Two-tailed Student’s t-test, D1NAc-VM n = 8, t(14) = −12.858, P < 0.001; D1NAc-VP n = 8, t(14) = 20.054, P < 0.001] ***P < 0.001. n Schematic of experimental design. After three-day laser-conditioning, photometry recording of Ca2+ transient of D1NAc-VM and D1NAc-VP projections during CPP/A test was performed. o Viral infection. AAV9-EF1α-DIO-GCaMP6m and AAV9-hSyn-FLEX-ChrimsonR-tdTomato were injected into the NAc of D1-Cre mice, with optical fiber implanted over the VM or VP. p, q (Top) Representative heat map of Ca2+ signaling in D1NAc-VM and D1NAc-VP projections during successive entries into optical stimulation paired side and the opposite side during CPP/A test. (Bottom) Averaged Ca2+ traces and quantification of peak amplitude of Ca2+ events around entry [Two-tailed Student’s t-test, D1NAc-VM n = 8, t(14) = −10.788, P < 0.001; D1NAc-VP n = 8, t(14) = −9.615, P < 0.001] ***P < 0.001.

