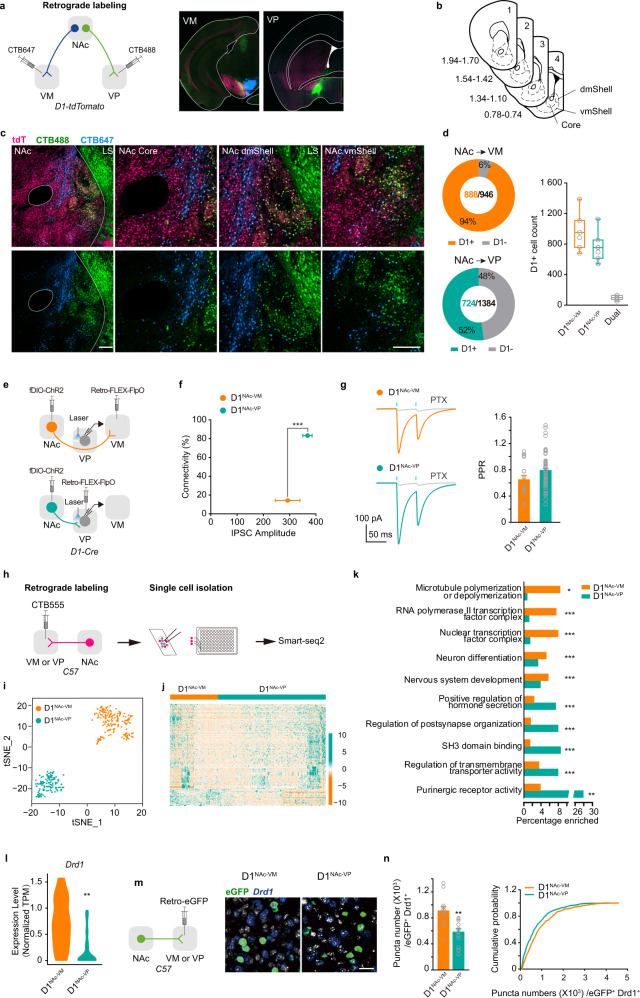
Fig. 4. D1NAc-VM and D1NAc-VP neurons are two populations with distinct anatomic, molecular, and electrophysiological features.
a Schematic of CTB labeling and confocal images for injections of CTB647 into the VM and CTB488 into the VP of D1-tdTomato mice. b Schemtic of sites imaged for quantification across the rostro-caudal gradient of NAc. c Confocal images for CTB labeled neurons in the NAc core, dmShell, and vmShell. Scale bar: 100 μm. d Left: quantification of CTB and tdTomato (D1-MSNs) overlap in the NAc. Right: summary of the number of CTB647+ D1-MSNs, CTB488+ D1-MSNs and double positive D1-MSN in the NAc [CTB647: 888 ± 89 cells, CTB488:724 ± 81 cells of 4 slices per mouse]. e Schematic of experimental design. Retrograde AAV2/retro-DIO-FlpO was injected in the VP or VM, combined with the injection of AAV9-EF1α-fDIO-ChR2-mCherry into the NAc of D1-Cre mice. f Connectivity plot summarizing optogenetic circuit mapping. In the VP, 83.3% of neurons were innervated by D1NAc-VP neurons (66 cells from 6 mice; average connectivity strength: 367.77 ± 17.66 pA), whereas only 14.3% VP neurons received innervation from D1NAc-VM neurons (112 cells from 8 mice; average connectivity strength: 292.13 ± 46.74 pA). Connectivity rate, Pearson χ2 ratio, 26.670, P < 0.001. g Representative responses to optogenetic stimulation (blue bars) of D1NAc-VM and D1NAc-VP projections in the VP. Currents were blocked by picrotoxin (PTX: 20 mM) [D1NAc-VM, 0.65 ± 0.07; D1NAc-VP, 0.79 ± 0.04; t(69) = −1.852, P = 0.0683]. h Workflow for single cell sequencing of D1NAc-VM and D1NAc-VP neurons retrogradelly labeled by CTB. i Unbiased clustering of D1-expressing neurons using t-SNE according to their whole-transcriptome correlation distance. Each cell is represented as a dot and colored by a clustering algorithm. j Heatmap of the differentially expressed genes between the two populations. Each column represents a single cell, and each row represents a single gene. The genes are ordered by hierarchical clustering the expression difference. Color represents the expression Z-score of the cells. k Gene ontology overrepresentation analysis of D1NAc-VM and D1NAc-VP populations. Bar length represents the number of genes differentially expressed in the population/the number of genes that are expressed and annotated to the pathway [Fisher’s exact test, see Supplementary information, Table S1]. *P < 0.05, **P < 0.01, ***P < 0.001. l Bar graph showing the expression of Drd1 in D1NAc-VM and D1NAc-VP neurons [Negative binomial generalized linear models, D1NAc-VM n = 120 cells, D1NAc-VP n = 182 cells, W = 2.607, P = 0.009.] **P < 0.01. m Viral infection and representative confocal images of eGFP and Drd1 expression in the NAc. C57 mice were injected with AAV2/retro-hSyn-eGFP into the VP or VM. Then smFISH was performed with Drd1 in the brain slice containing the NAc. Scale bar: 25 μm. n Quantification bar graph and cumulative frequency distribution of Drd1 expression in D1NAc-VM and D1NAc-VP neurons (Drd1+ eGFP+). [Two-tailed Student’s t-test, t(23) = 3.757, P = 0.001; Kolmogorov-Smirnov test, P < 0.001.] **P < 0.01, ***P < 0.001.

