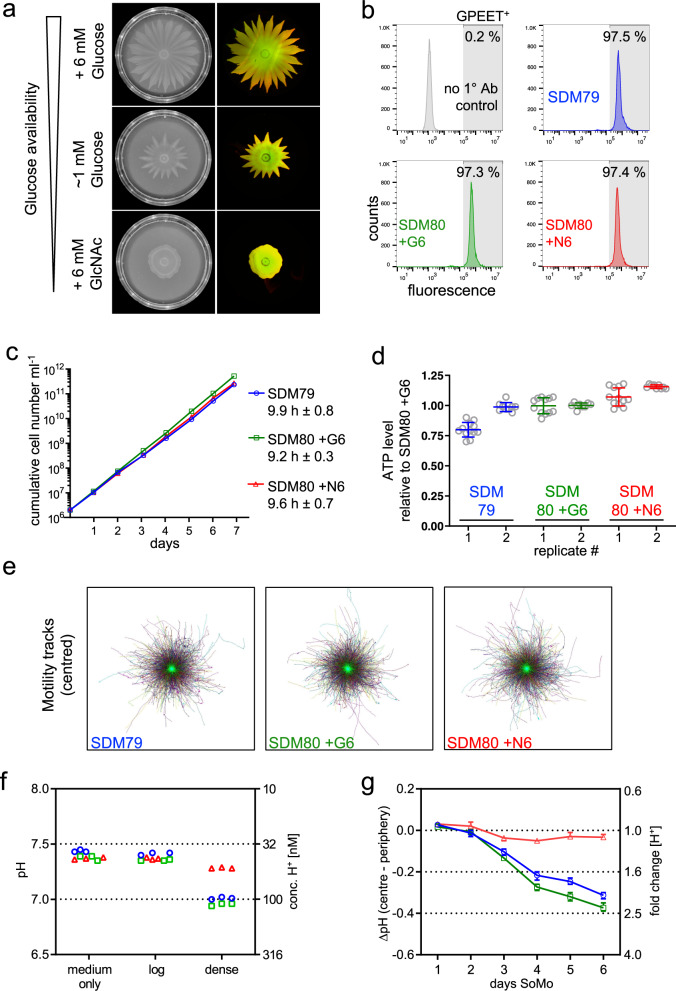
Fig. 5. Glucose availability impacts SoMo by acidification of the culture medium.
Procyclic forms (Lister 427 Bern) grown in SDM79 or SDM80 plus supplements were analysed: SDM79 (blue/open circle), SDM80 + G6 (+6 mM glucose, green/open square), SDM80+N6 (+6 mM GlcNAc, red/open triangle). If not specified, cells were adapted from SDM79 to the medium indicated for one to three weeks. a Social motility on semi-solid plates was assessed in SDM80 with varying glucose availability. Left: SoMo plates on day 6 after inoculation, prior to performing community lifts. Cells were adapted from SDM80+G6 to the corresponding liquid medium for 5 days before inoculation. Right: merge of the corresponding community lifts probed for GPEET (red) and EP (green). b Flow cytometric analysis. The percentage of GPEET-positive cells (shaded area) is indicated. Cells grown in SDM79 were used as a control (2° antibody only, grey). c Cumulative growth in different media. Growth was monitored after transferring cells from SDM79 to the corresponding medium 3 days earlier. Numbers indicate population doubling time averaged over 7 days (mean ± SD). d Steady-state ATP levels in different media. Cell lysates were harvested in two independent experiments (replicate 1 or 2, respectively). Cell densities at harvest were between 6.2–8.0 or 7.3–8.9 ×10⁶ cells ml-1, respectively. Appropriate dilutions of cell lysates were assayed; the graph depicts means and error bars (SD) of technical replicates shown as circles (n = 12 or 9, respectively). Data are shown relative to SDM80+G6. e Directional motility in different media. Cell densities at harvest were between 5.9–6.5 × 10⁶ cells ml−1. Centred motility tracks of individual cells are shown at identical scale. >6000 tracks in each medium were pooled from nine movies acquired from three technical replicates. f pH measurement of liquid cultures. Culture medium (medium only) and supernatants from log-phase (log) or dense culture (dense). Cell titres per ml in SDM79, SDM80+G6 or SDM80+N6, respectively: 3.2 × 10⁶, 3.8 × 10⁶ or 3.3 × 10⁶ (log) and 5.1 × 10⁷, 4 × 10⁷or 3.6 × 10⁷ (dense). Three technical replicates are shown for each condition. The corresponding H+ concentration is indicated on right y-axis. g pH measurements on SoMo plates inoculated with cells pre-adapted to the corresponding liquid medium. ∆pH (centre−periphery) refers to pH in centre of the community minus the pH at the plate periphery. Each data point represents the mean ∆pH from replicate plates, error bars depict the range (n = 3). The fold change in H+ concentration is indicated on the right y-axis. Source data are provided as a Source Data file.

