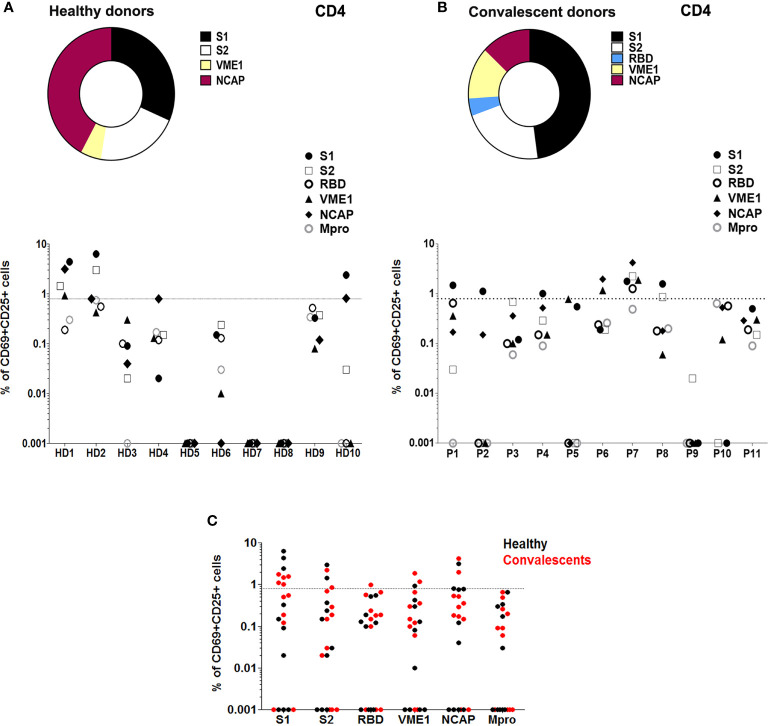
Figure 1.
T cell reactivity profile to SARS-CoV-2 in healthy and convalescent individuals before vaccination. (A) Upper panel, proportion of HD (n=10) with SARS-Cov-2-reactive CD4+ T cells after stimulation with different peptide pools as indicated. Lower panel, T cell activity against different peptide pools measured in each HD. (B) Upper panel, proportion of CD (P; n=11) with SARS-Cov-2-reactive CD4+ T cells after stimulation with different peptide pools as indicated. Lower panel, T cell activity against different peptide pools measured in each CD. (C) T cell activation in HD (black) and CD (red), in the presence of specific SARS-CoV-2 peptide pools. T cell activity was measured as specific percentage, considered positive when ≥ 0.85% (dotted lines).

