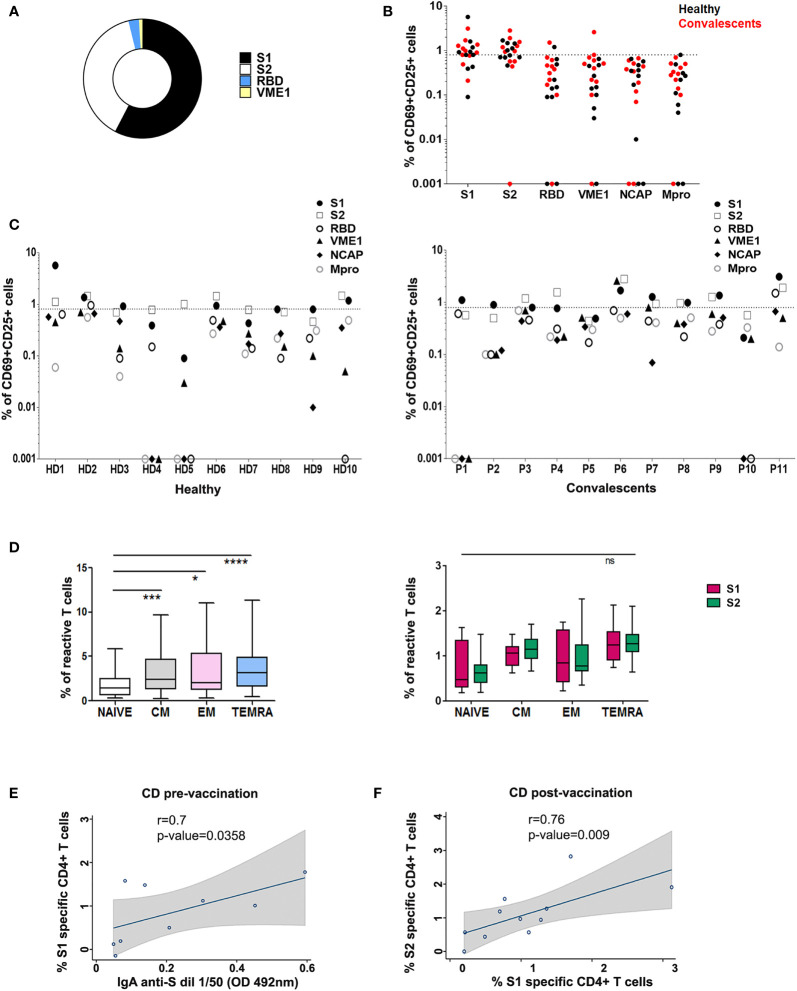
Figure 2.
T cell reactivity profile to SARS-CoV-2 in healthy and convalescent individuals after vaccination. (A) Proportion of HD and CD (P) (n=21) with SARS-CoV-2 reactive CD4+ T cells after stimulation with different peptide pools as indicated. (B) Post-vaccination CD4+ T cell activation in HD (black) and CD (red), in the presence of specific peptide pools. (C) CD4+ activity against different peptide pools in each HD (left) and CD (P; right). T cell activity was measured as specific percentage, considered positive when ≥ 0.85% (dotted line). (D) Left, CD4+ T memory subsets specific for SARS-CoV-2 peptide pools in vaccinated donors. *p < 0.05; ***p < 0.001; ****p < 0.0001; Right, Comparison of CD4+ T memory subsets specific for S1 and S2 peptide pools in vaccinated donors; ns, non-significant. (E) Correlation between SARS-CoV-2 S1 specific CD4+ T cells (%) and IgA anti-S in CD pre-vaccination. (F) Correlation between SARS-CoV-2 S1 specific CD4+ T cells and SARS-CoV-2 S2 specific CD4+ T cells (%) in CD post-vaccination. Spearman correlations were calculated. Fitted linear prediction and its 95% confidence interval (transparent gray shadow) are shown.

