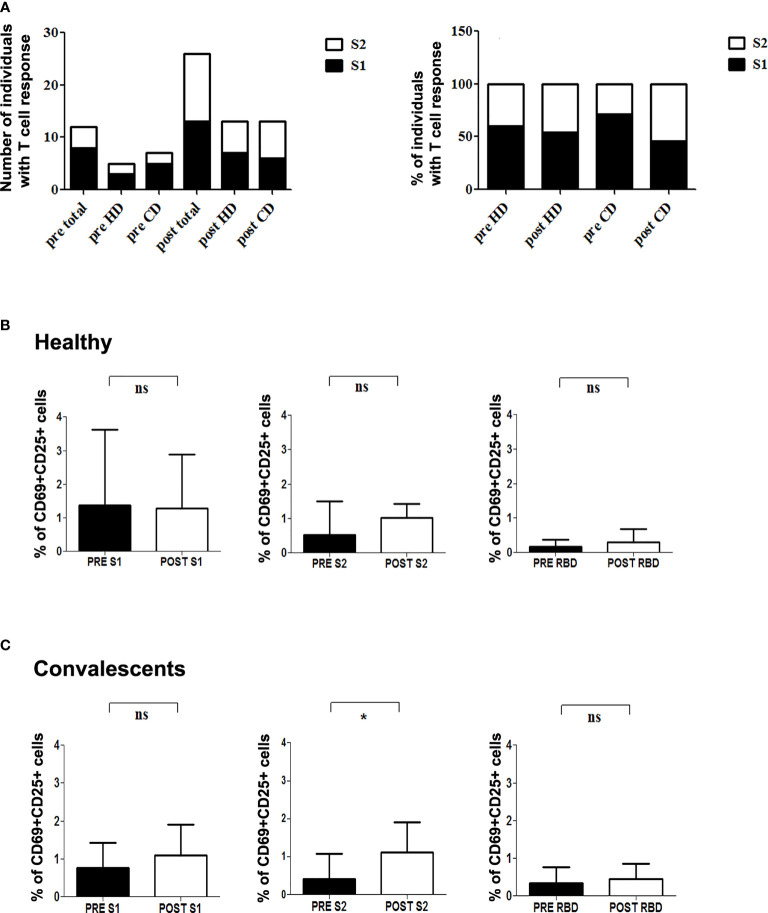
Figure 3.
T cell reactivity to SARS-CoV-2 S protein in healthy and convalescent individuals before and after vaccination. (A) Left, absolute number of individuals with CD4+ reactive lymphocytes against S1 (black) and S2 (white) before (pre) and after (post) vaccination. Right, Relative percentage of S-protein positive donors reactive for either S1 (black) or S2 (white) in each condition. (B, C) Graphics show specific percentage of HD (B) and CD (C) before (pre) and after (post) vaccination in the presence of S1 (left), S2 (middle) and RBD (right) peptide pools. Statistical analysis was performed with the paired Student’s t-test. *p=0.045; ns, not significant.

