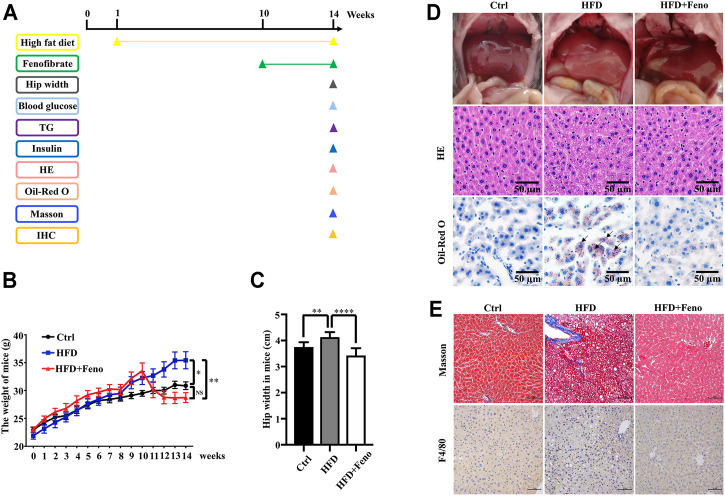
FIGURE 1.
Fenofibrate attenuates body mass, liver histology in HFD-fed mice. (A) Mice experiment process plan diagram. Effects of fenofibrate on bodyweight (B) and hip-width (C) after 14 weeks. These results are means ± SD (n=6−10 mice/group). *p < 0.05, **p < 0.01, ****p < 0.0001, HFD group versus control group, or fenofibrate + HFD-fed group versus HFD group. (D) Liver gross morphology, hepatic macrosteatosis, and fat deposition of mice in each group (original magnification ×200; scale bar, 50 μm). (E) Masson staining and F4/80 staining of liver tissue in each group (magnification ×200; scale bar, 50 μm).

