FIGURE 2.
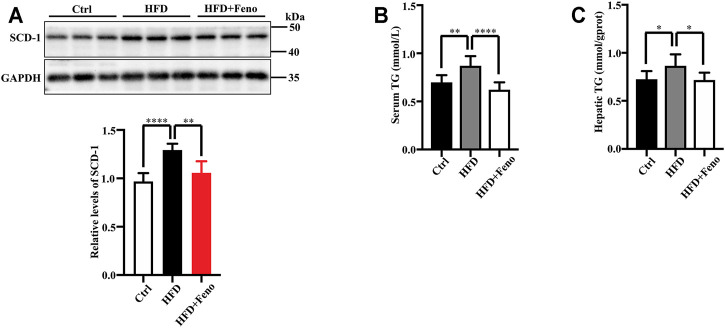
Fenofibrate attenuates lipid accumulation in HFD-fed mice. (A) The levels of SCD-1 were measured by western blotting after 14 weeks. Representative western blots are shown. These results are means ± SD (n = 5–8 mice/group). **p < 0.01, ****p < 0.0001, HFD group versus control group, or fenofibrate + HFD-fed group versus HFD group. (B) Serum triglyceride (TG) levels and (C) hepatic TG levels. These results are means ± SD (n = 10). *p < 0.05, **p < 0.01, ****p < 0.0001, HFD group versus control group, or fenofibrate + HFD-fed group versus HFD group.

