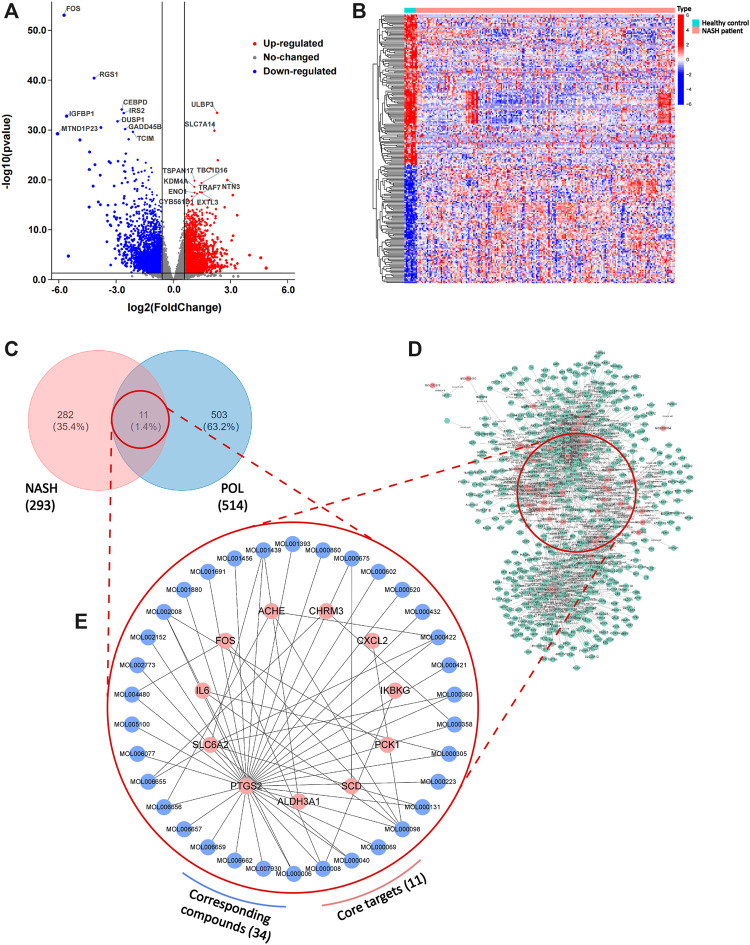
FIGURE 3.
DEGs in patients with NASH and healthy people and the intersected genes of DEGs and predicted targets. The dataset (GSE135251) was downloaded from GEO Datasets. Then, DEGs were calculated by limma package and plotted by R. Volcano plot of DEGs (A) and heatmap plot of DEGs (B) were graphed and red dots represented up-regulated genes while blue represented down-regulated genes. Top ten up-regulated and down-regulated genes were labeled. Then, predicted targets of POL (D) were obtained from TCMSP database. The intersected genes (N&P) of DEGs and predicted targets (C) were graphed by Venn diagram. The network of corresponding compounds and core genes (N&P) (E) was graphed by Cytoscape. Blue circles represented constitutes of POL while red represented core genes (N&P).

