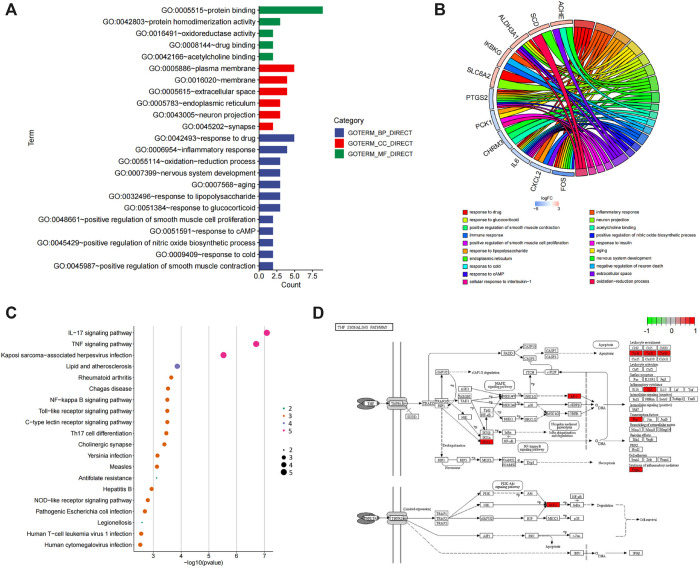
FIGURE 4.
GO and KEGG enrichment of N&P. The core intersected genes (N&P) were analyzed by GO enrichment (A,B). The green, red, and blue boxes represented biological process, cellular component, and molecular function, respectively. The top five results of GO enrichment were shown. Then, N&P were analyzed by KEGG enrichment (C). The top twenty signaling pathways were listed and the pink circles represented the top three signaling pathways. The TNF signaling pathway, one of the top two signaling pathways, was analyzed (D). The red boxes represented the core genes (N&P) in the TNF signaling pathway.

