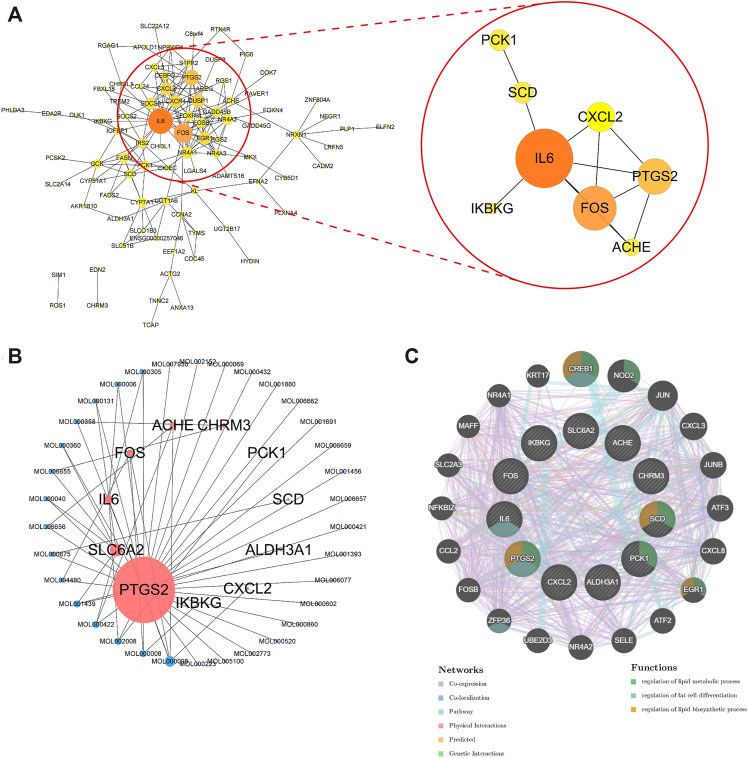
FIGURE 5.
Protein-protein network analysis and topological analysis of N&P. Protein-protein network of core genes (A) was graphed by Cytoscape. The network of corresponding components from POL and core genes (N&P) (B) was graphed by Cytoscape. Pink node represented the core genes while blue represented the corresponding components. Node size is proportional to its degree. The larger the area is, the more important it is in the network. Topological network of N&P (C) was graphed by GeneMANIA. The different color lines represented the network relationships while the different color circles represented the gene functions.

