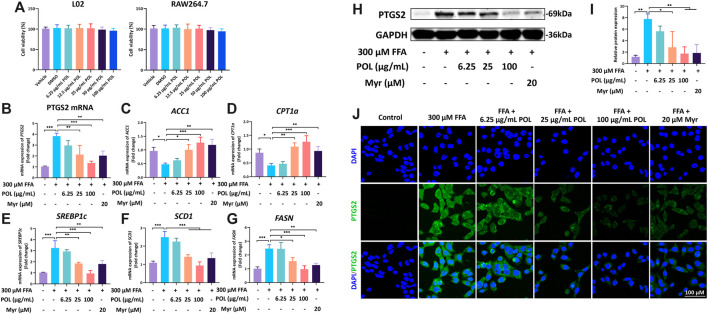
FIGURE 8.
The effects of POL and Myr on the protein and mRNA expression of PTGS2 and the mRNA expression of CPT1a, FASN, SCD1, ACC1, and SREBP1c in FFA-induced L02. L02 cells were incubated with 300 μM FFA (oleic acid: palmitic acid = 2: 1) and treated with 6.25, 25, and 100 μg/ml POL and 20 μM Myr for 24 h, respectively. (A) Cell viabilities of L02 and RAW264.7 treated with 6.25, 25, and 100 μg/ml POL. The mRNA expression of PTGS2 (B), ACC1 (C), CPT1a (D), SREBP1c (E), SCD1 (F), and FASN (G) were determined by qt-PCR. Then, the protein expression of PTGS2 was detected by western blot (H) and immunoflurescence staining (I) and. The relative protein expression of PTGS2 was calculated (J). Comparing with model group, *p < 0.05, **p < 0.01, ***p < 0.001.

