Fig. 4.
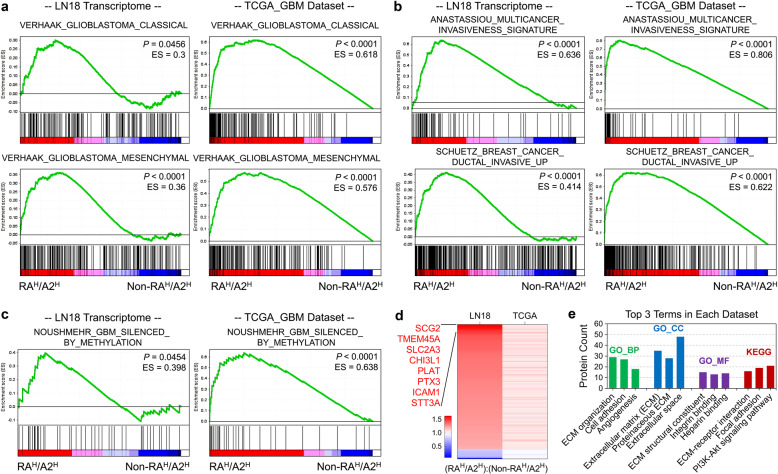
Transcriptomic analyses on PDGFRA and EPHA2 co-upregulation in GBM cells. a Enrichment of signature genes of GBM molecular subtype for LN18 cells with co-transfection of EPHA2 and PDGFRA (RAH/A2H) vs. individual transfection (Non-RAH/A2H) (left two panels), as well as, cases with PDGFRAHigh/EPHA2High (RAH/A2H) vs. all other (Non-RAH/A2H) cases from TCGA_GBM mRNA expression dataset (right two panels). b Enrichment of signature genes of invasive growth for LN18 cells with RAH/A2H vs. Non-RAH/A2H cases (left two panels), as well as, cases with RAH/A2H vs. Non-RAH/A2H from TCGA_GBM mRNA expression dataset (right two panels). c Enrichment of signature genes of GBM G-CIMP subtype for LN18 cells with RAH/A2H vs. Non-RAH/A2H (left panel), as well as, cases with RAH/A2H vs. Non-RAH/A2H cases from TCGA_GBM mRNA expression dataset (right panel). d Heatmap graph of consistently altered genes in LN18 cells with RAH/A2H vs. Non-RAH/A2H (left lane) and cases with RAH/A2H vs. Non-RAH/A2H cases from TCGA_GBM mRNA expression dataset (right lane). e David analysis on consistently altered genes in LN18 cells with RAH/A2H vs. Non-RAH/A2H (left lane) and cases with RAH/A2H vs. Non-RAH/A2H cases from TCGA_GBM mRNA expression dataset (right lane). Categories with tops 3 protein counts are showed in the graph.

