Fig. 5.
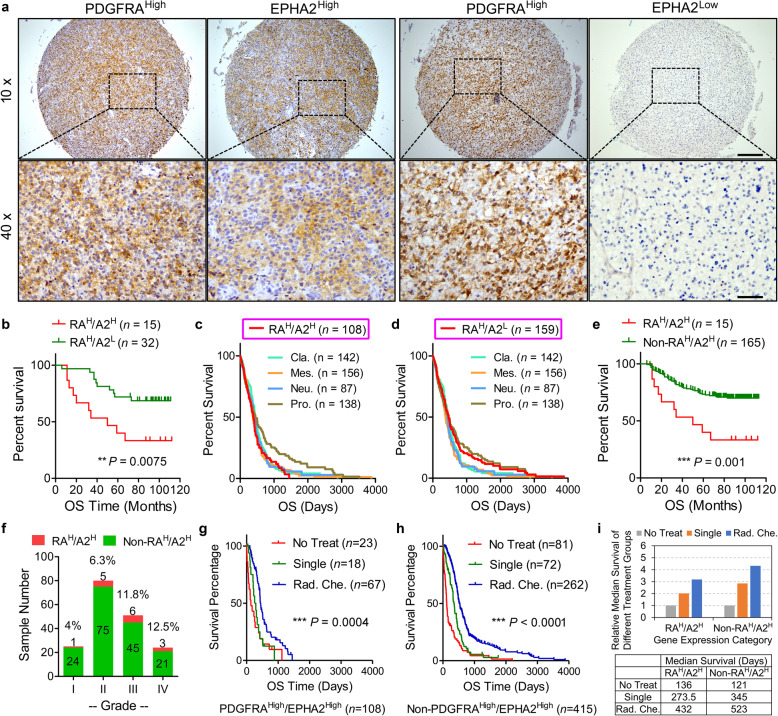
Clinical significance of EPHA2 and PDGFRA in GBM. a Representative immunohistochemistry images of EPHA2 and PDGFRA proteins on continuous tissue sections. Scale Bar = 200 μm (upper) and 50 μm (lower). b Kaplan–Meier survival analysis on cases with PDGFRAHigh/EPHA2High vs. PDGFRAHigh/EPHA2Low from our glioma cohort. c Survival curve comparison between cases with PDGFRAHigh/EPHA2High and different molecular subtypes according to TCGA_GBM mRNA expression dataset. d Survival curve comparison between cases with PDGFRAHigh/EPHA2Low and different molecular subtypes according to TCGA_GBM mRNA expression dataset. e Kaplan–Meier survival analysis on cases with PDGFRAHigh/EPHA2High vs. all other cases from our glioma cohort. f Case count with different protein expression patterns from our glioma cohort according to tumor grades. g, h Kaplan–Meier survival analysis of different treatment ways under specific gene expression patterns according to TCGA_GBM database. i Therapeutic effects of treatment ways on survival time of patients with specific gene expression patterns.

