Fig. 6.
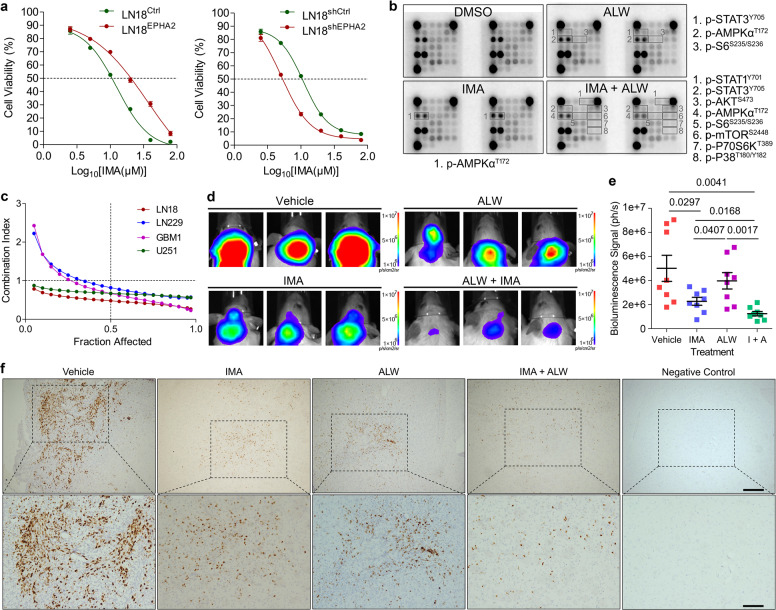
Co-inhibition of PDGFRA and EPHA2 synergetically inhibits GBM cells. a IC50 measurement of LN18 cells with forced expression of EPHA2 (left panel) or knockdown of EPHA2 (right panel) through MTT assay. b Antibody array analysis of LN18 cells treated with vehicle, EPHA2 inhibitor (ALW), and PDGFRA inhibitor (IMA). Significant changed proteins are labeled with frame and listed separately. c MTT assay-based drug combination evaluation in four GBM cell lines. d Representative images of orthotopic growth of U251 cells treated with vehicle, IMA, ALW, or IMA + ALW. e Statistic graph of tumor size using bioluminescence signal intensity. n = 8 for each group. f Representative immunohistochemistry images of Ki67 on tissue sections from mice with orthotopic GBM tumors treated by vehicle, IMA, ALW, or IMA + ALW. Scale Bar = 200 μm (upper) and 100 μm (lower).

