Fig. 4.
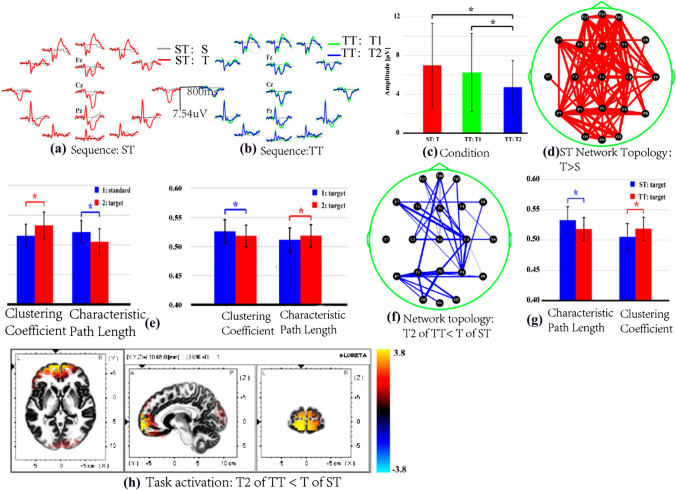
One example of EEG network analysis on cognitive functions. a and b The event-related potentials (ERPs) of ST and TT sequences during the P300 task respectively, where P300 originates from the positive peak latency of ERP wave is so 300 ms. c P300 amplitude evoked by the ST and TT sequences. d Network topology of ST sequence, the red lines describe the stronger edges of T than that of S stimulus, while the line width does the quantitative variances of edge strengths. e Network attributes of two sequences, the blue bar denotes the network feature of the first stimulus, and the red one does that of the second one. f Network topology: the blue lines describe the weaker edges of T2 in TT than that of T in ST, and the line width does the quantitative variances of edge strengths under those conditions. g Network attributes, the red and blue bars describe the network attributes of T2 in two stimuli, respectively. h Task activation.
Adapted from the paper (Li et al. 2018a)

