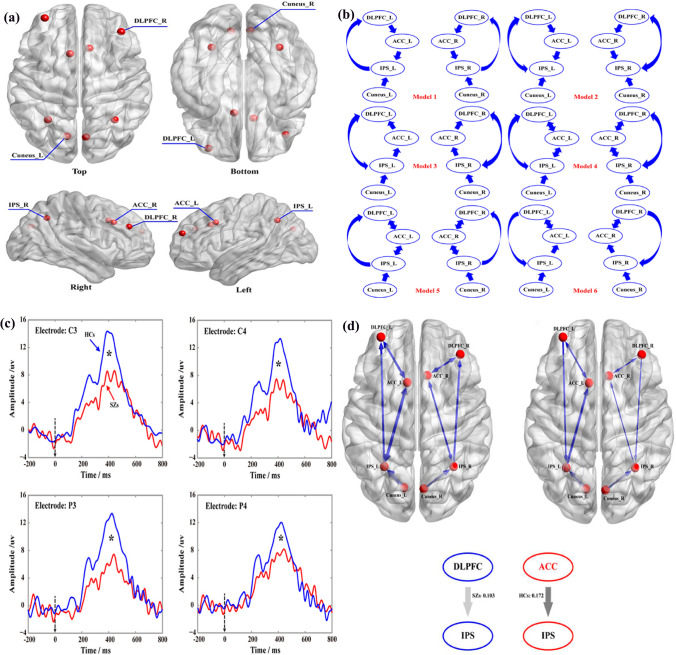
Fig. 6.
One example of EEG network analysis on neural disorders with DCM effective network. a The distribution of specific 8 DCM nodes from the top, bottom, left, and right. b Constructs 6 DCM connectivity from the 8 specific nodes via the existing P300 knowledge. c Averaged P300 waveforms for SZs and health controls (HCs), the red line for P300 of SZs, and the blue one for that of HCs. d The causal relationship in SZs and HCs with DCM. The top left model is for HCs and the top right one for SZs, the down graphs denote the direction of the information flow between two nodes and the strength of information flow.
Adapted from the reference (Li et al. 2018e)

