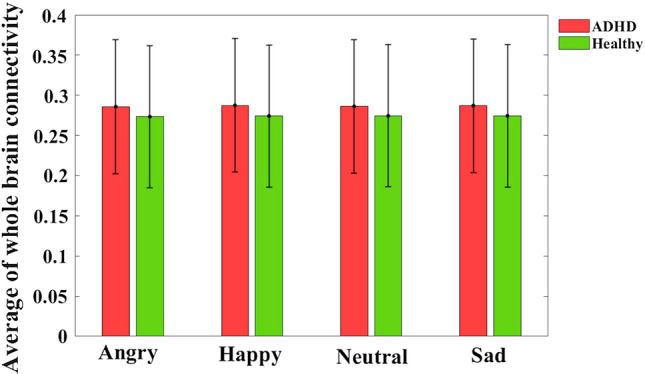
Fig. 3.

Average of whole brain connectivity in all types of emotions. In each bar graph, the center of the drawn error bar is the average of the functional connectivity. The lines drawn with the same length above and below the center of the error bar show the standard deviation related to each group in different types of emotions. Details of the bar graphs are presented in Table 2. No significant differences are found in all emotional types between two ADHD and healthy groups (P-value > 0.01)
