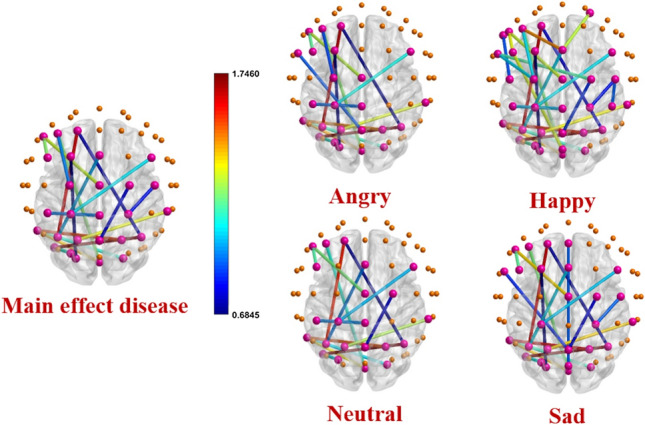
Fig. 4.

Channel pairs with significant differences in shortest path length in main effect disease and interaction effect ”diseaseemotion” for all emotions. The spheres represent 62 electrode channels in different brain regions. The pink spheres show electrode channels with significant connections in the shortest path length between the two ADHD and healthy groups. The other spheres show the electrode channels that do not have significant connections. The colored lines represent the significant edges between the pairs of electrode channels. The corresponding colors express the level of shortest path length differences between two healthy and ADHD groups. Edges with warm colors show high shortest path length differences between two ADHD and healthy groups. Cold color edges represent connections with low differences. Details of the common significant connections are presented in Table 3. The shortest path length of all these connections (except CZ-F5, F5-FC3, and PO3-PO7) is higher in the ADHD group than the healthy one indicating less segregation of information in the related channel pairs in ADHD neuronal networks
