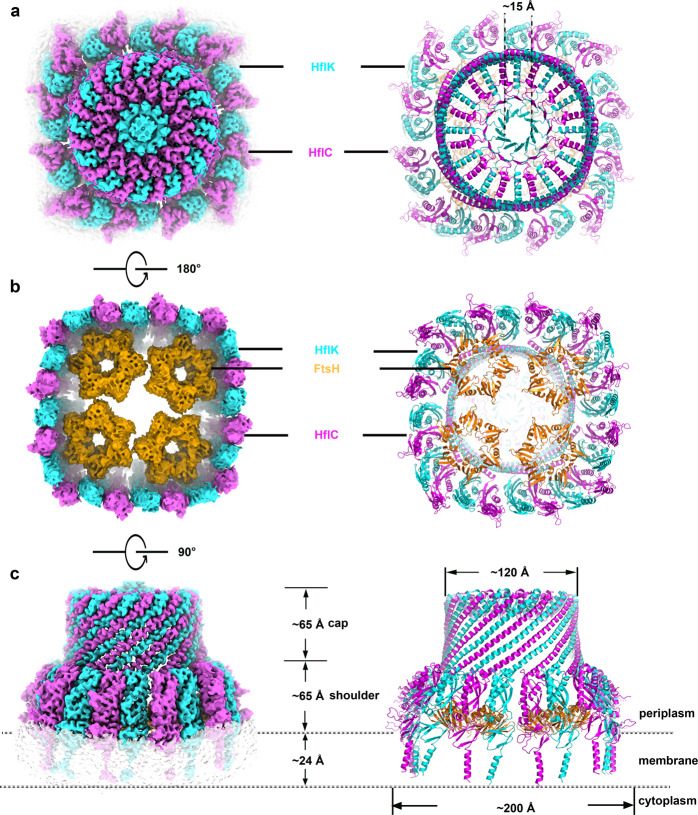
Fig. 2. The overall structure of the intact KCF complex.
a Top view (periplasmic view) of the cryo-EM map (left) and atomic model (right) of the KCF complex. b Bottom view (cytoplasmic view) of the cryo-EM map (left) and atomic model (right) of the KCF complex. c Side view of the cryo-EM map (left) and atomic model (right) of the KCF complex. Subunits of HflK, HflC and FtsH are colored cyan, magenta and orange, respectively.

