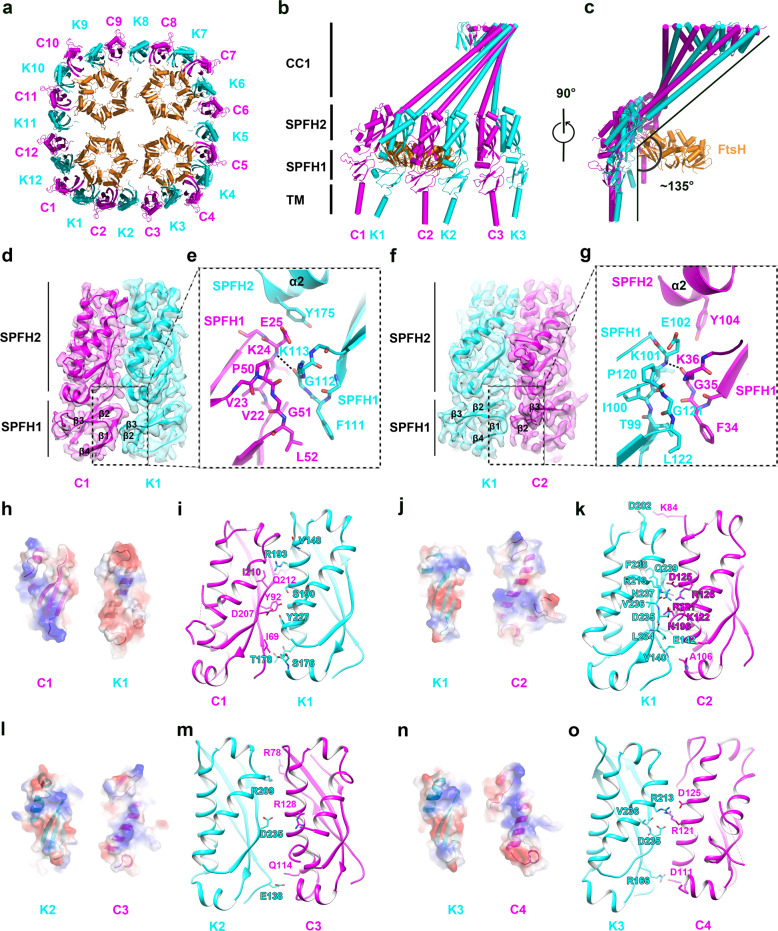
Fig. 4. Interface between HflK and HflC.
a A cutaway view of the KCF complex (viewed from the periplasmic side). HflK, HflC and FtsH are colored cyan, magenta and orange, respectively. Protomers of HflK (K1 to K12) and HflC (C1 to C12) are numbered anti-clockwisely. b, c Side view of a quarter of the KCF complex (one unsymmetrical unit). Subunits of HflK, HflC and FtsH are similarly colored as in a. d Domain interface between C1 and K1 in the SPFH1 region. The cryo-EM maps of the SPFH1 and SPFH2 domains are shown in transparent surface representation with atomic models superimposed. In the C1–K1 interface, the F111–G112–K113 loop (β2–β3 loop) of HflK contacts two loops (β1–β2 and β3–β4 loops) of HflC–SPHF1. e Detailed interactions between adjacent SPFH1 domains in the C1–K2 interface, including a hydrogen bond between main-chain atoms of G112 of K1 and K24 of C1, and a hydrophobic stacking between L52 of C1 and F111 of K1. f Same as d, but for the K1–C2 interface. In the C1–K2 interface, the F34–G35–K36 loop (β2–β3 loop) of HflC contacts two loops (β1–β2 and β3–β4 loops) of HflK-SPHF1. g Detailed interactions between adjacent SPFH1 domains in the C1–K2 interface, including a hydrogen bond between main-chain atoms of G35 of C2 and K101 of K1, and a hydrophobic stacking between L122 of K1 and F34 of C2. Note that the three interacting loops share identical sequences between HflK and HflC (See also Supplementary information, Fig. S6a). h Electrostatic surface potential of the interface between the SPFH2 domains of HflC (C1) and HflK (K1). i The C1–K1 interface is shown in cartoon representation, with interacting residues highlighted in stick models. j–o Same as h and i, for the K1–C2 (j, k), K2–C3 (l, m) and K3–C4 (n, o) interfaces.

