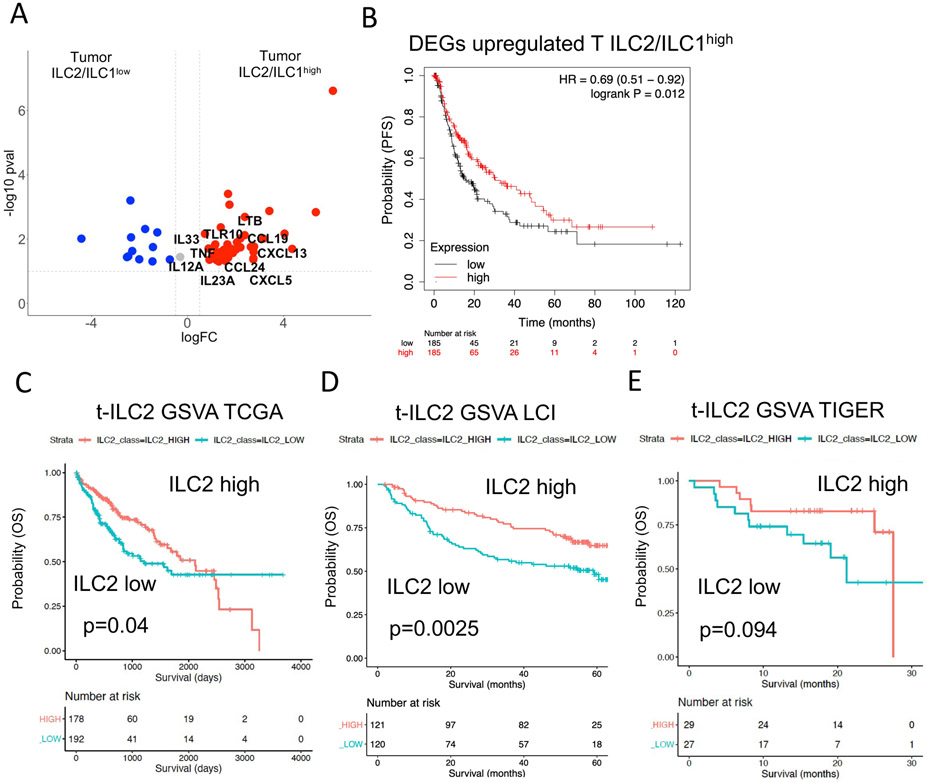
Figure 6. Survival analysis using large HCC cohorts reveals better survival in patients with high tumor ILC2 signature mediated by IL-33.
A. Volcano plot showing DEGs from comparison of bulk RNA sequencing data from tumors of ILC2/ILC1high vs tumors of ILC2/ILC1low patients filtered for cytokines, cytokine receptors and growth factors.
B. Survival risk prediction using significantly upregulated DEGs (p<0.05, logFC>0.58) in tumors of ILC2/ILC1high patients. Progression-free survival (PFS) risk probability based on high or low expression in TCGA liver cancer cohort split by median.
C. Geneset variance analysis (GSVA) using a signature of tumor c-Kit− ILC2s derived from single-cell sequencing analysis (Table S6). Analysis of survival prediction within TCGA liver cancer cohort.
D. Same analysis as in Figure 6C, now analyzing patients of the LCI liver cancer cohort.
E. Same analysis as in Figure 6C, now analyzing patients of the TIGER liver cancer cohort.

