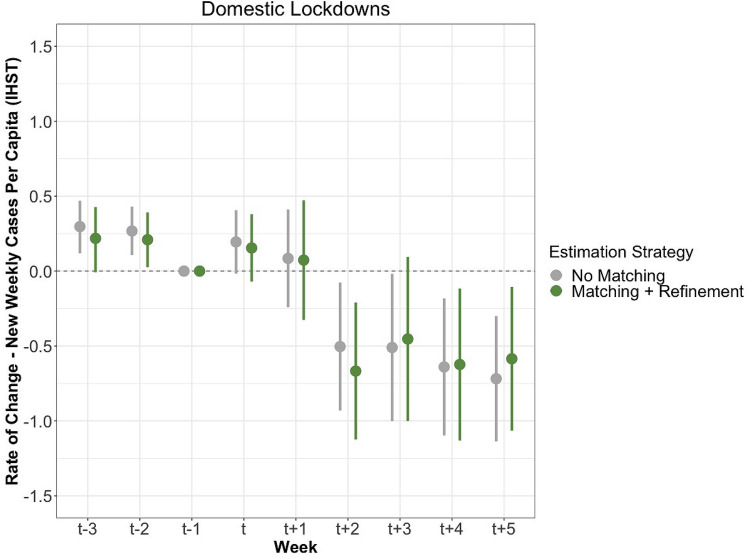
Figure 2.
This figure illustrates the measured effects of a domestic lockdown on the rate of change of new cases per capita after IHST (y-axis). The estimates in grey were generated with neither matching nor refinement, while the green estimates were generated with matching and refinement, both displayed with 95% confidence intervals. The refinement strategy selected is covariate balancing propensity score matching. The period includes nine weeks, three prior to the lockdown, the week of the lockdown, and five following the lockdown.

