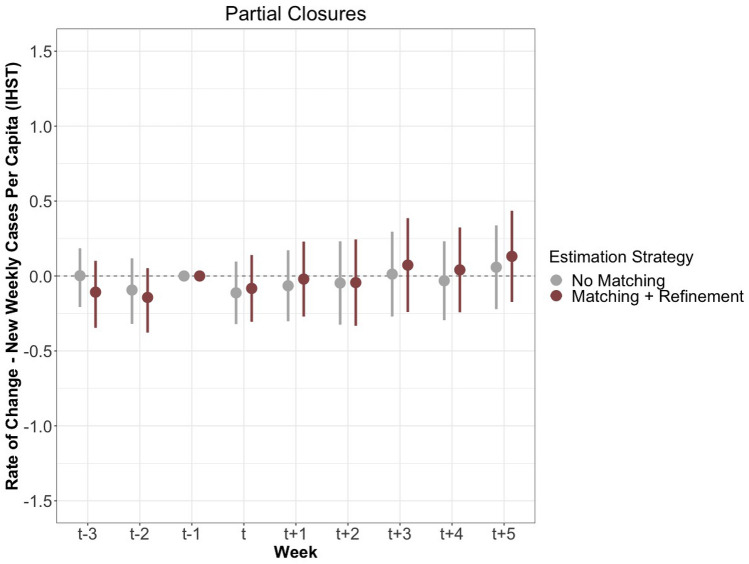
Figure 4.
This figure shows the measured effects of partial closures on the rate of change of new cases per capita after IHST (y-axis). The estimates in grey were generated with neither matching nor refinement, while the red estimates were generated with matching and refinement, both displayed with 95% confidence intervals. The optimal refinement strategy selected is covariate balancing propensity score matching. The period includes nine weeks: three prior to the border closure, the week of the closure, and five following the closure.

