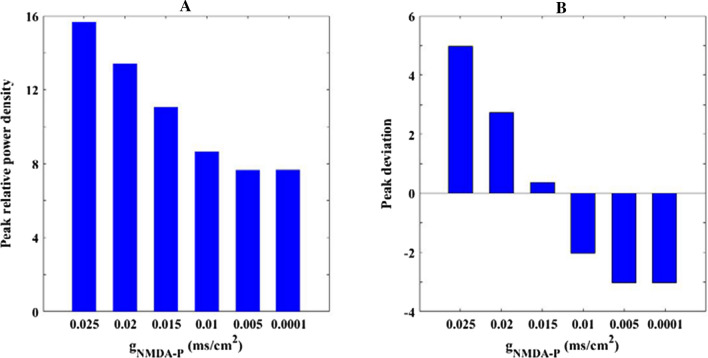
Fig. 5.
The peak of relative power density within alpha band (A) and the corresponding peak deviation between the peak of relative power density and their mean (B) for some synaptic strength : 0.025, 0.02, 0.015, 0.01, 0.005, 0.0001. There is an obvious decrease in the peak of relative alpha band power density upon decreasing parameter

