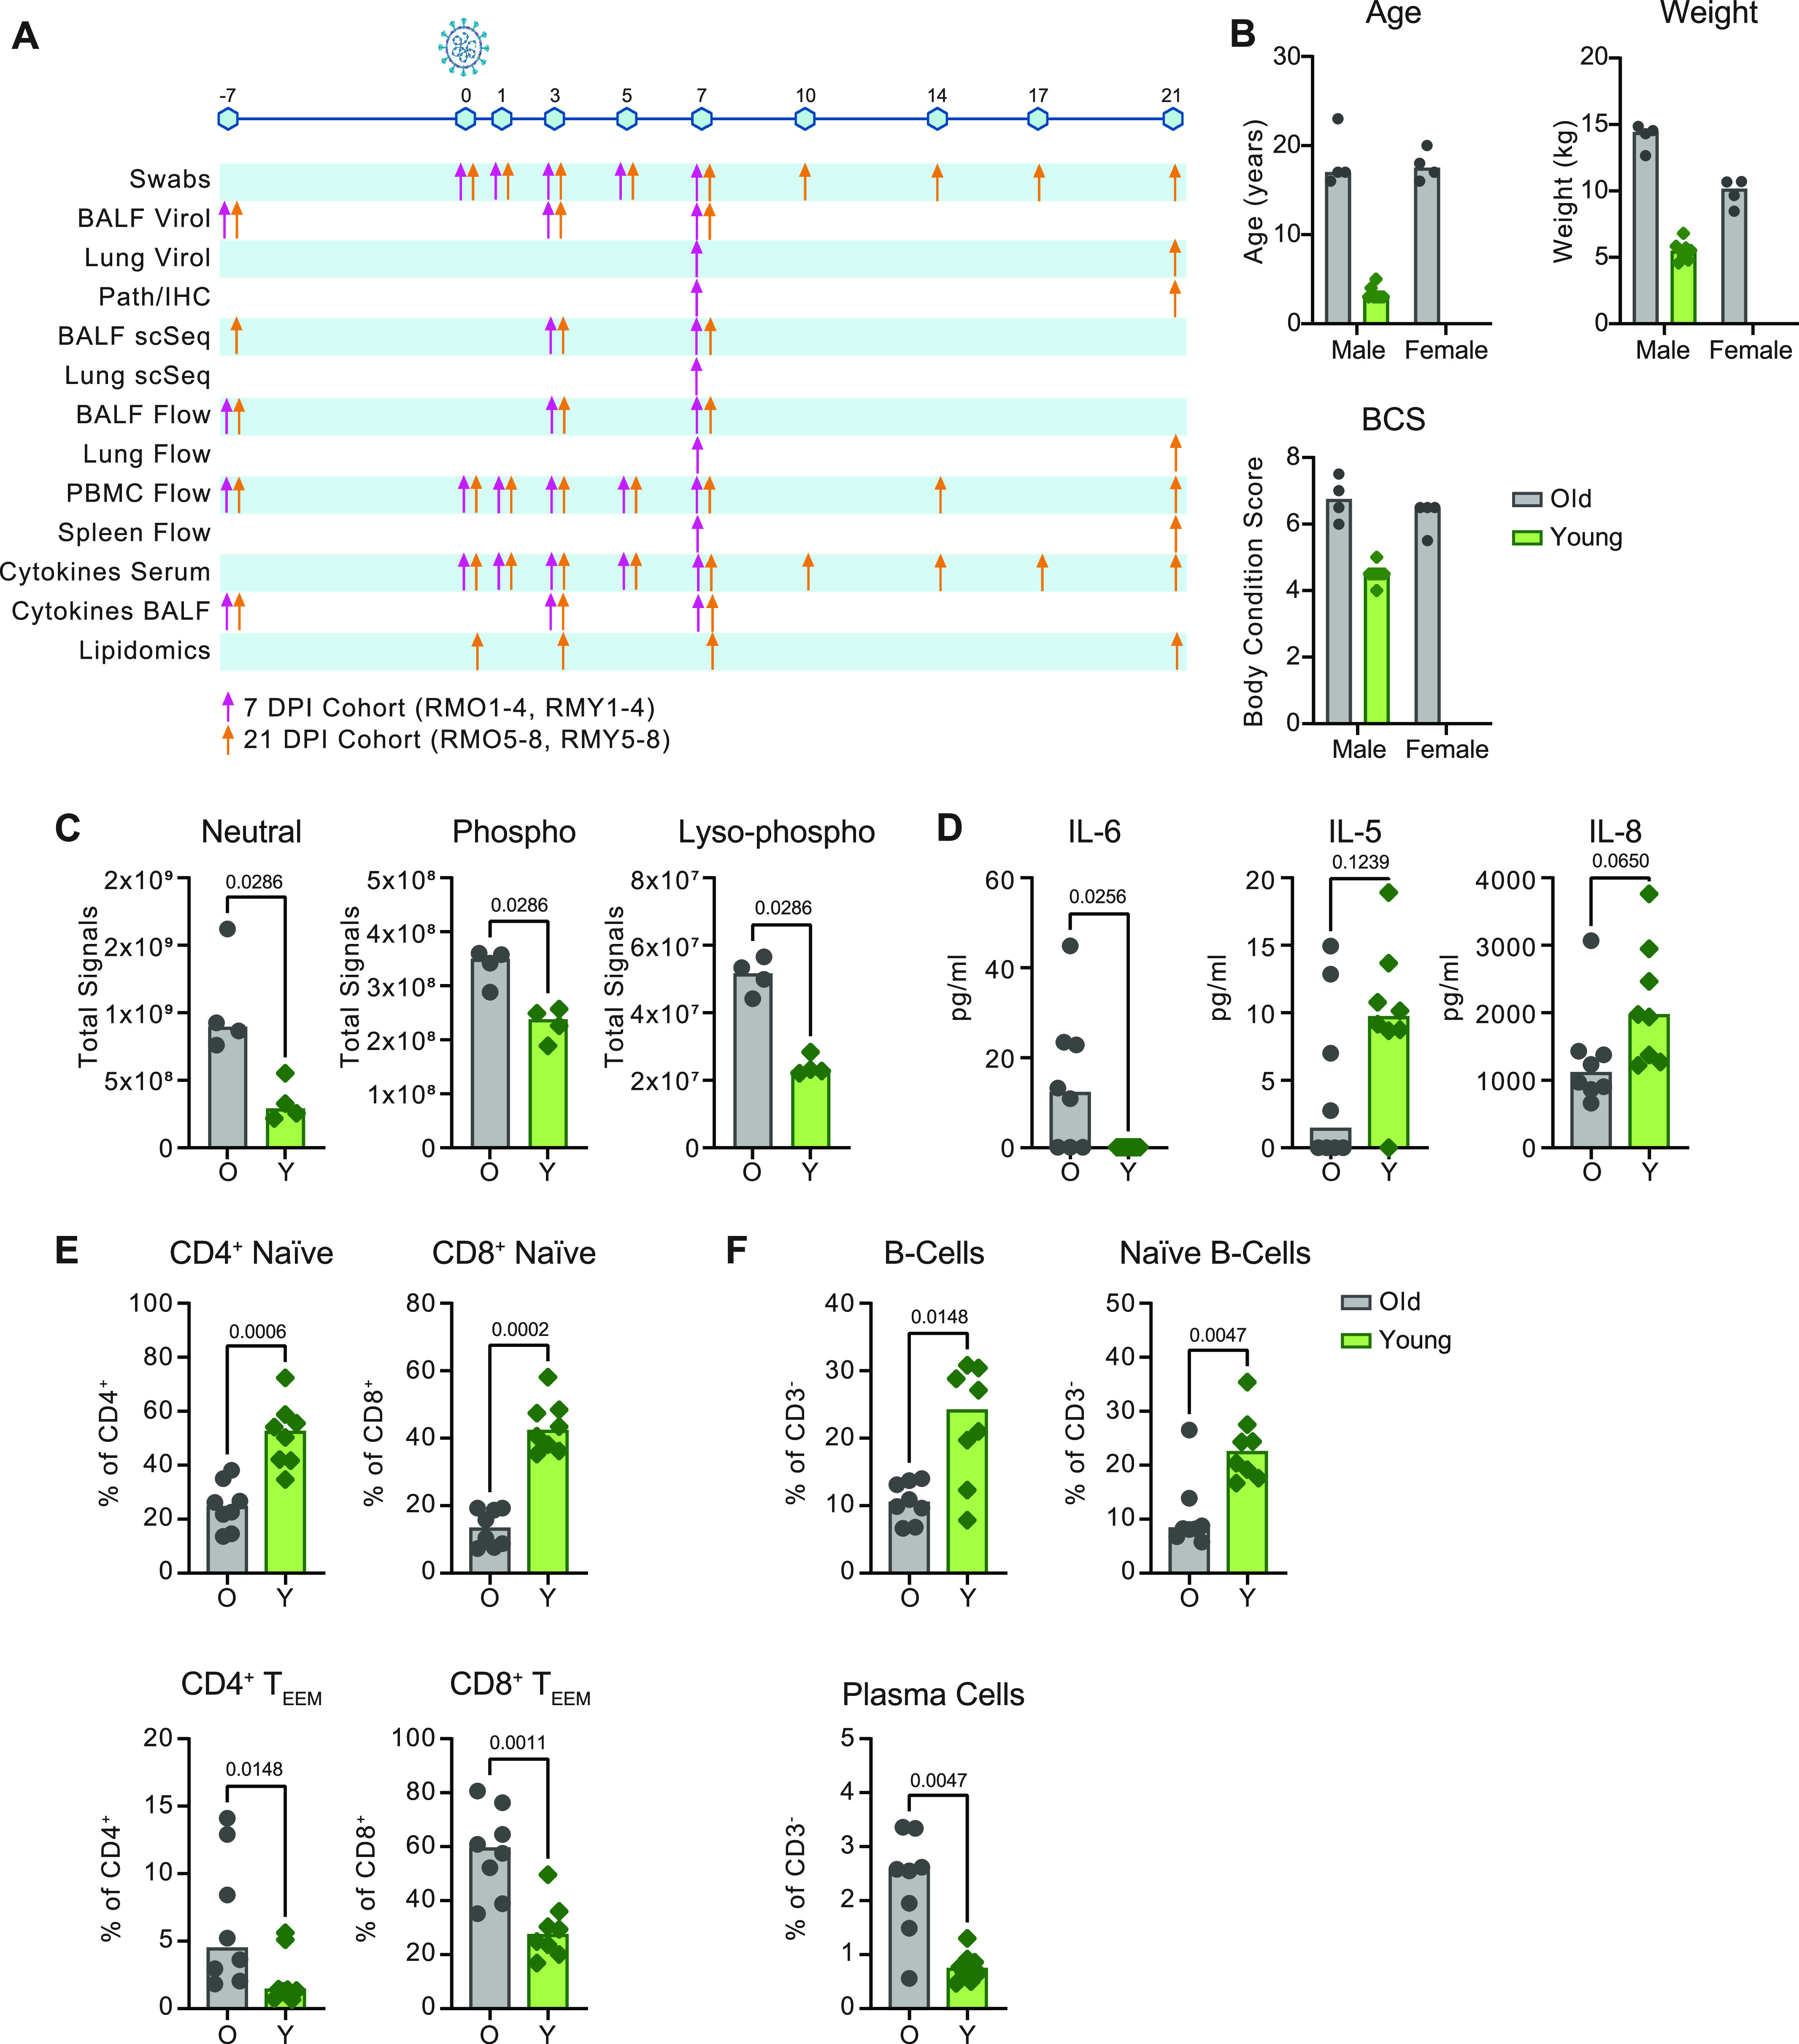
Figure 1. Multi-omics data collection and baseline comparison between old and young rhesus macaques.

(A) Overview of samples collected. Sampling time points are depicted across the timeline as days post inoculation (dpi). The colored arrows indicate sampling performed on animals necropsied at 7 dpi (pink) or animals necropsied at 21 dpi (orange). BALF = bronchoalveolar lavage fluid, IHC = immunohistochemistry. (B) Summary of age, weight and body condition score divided by sex. (C, D, E, F) Baselines of total lipid signal by lipid class (C), serum cytokines (D), circulating T-cell subsets (naïve and effector/effector-memory [TEEM]) (E), and circulating B-cell subsets (F) present at different concentrations (C, D) or frequencies (E, F) pre-inoculation (−7 or 0 dpi). Grey represents older and green represents younger rhesus macaques. P-values were calculated using the Mann–Whiney U test.
