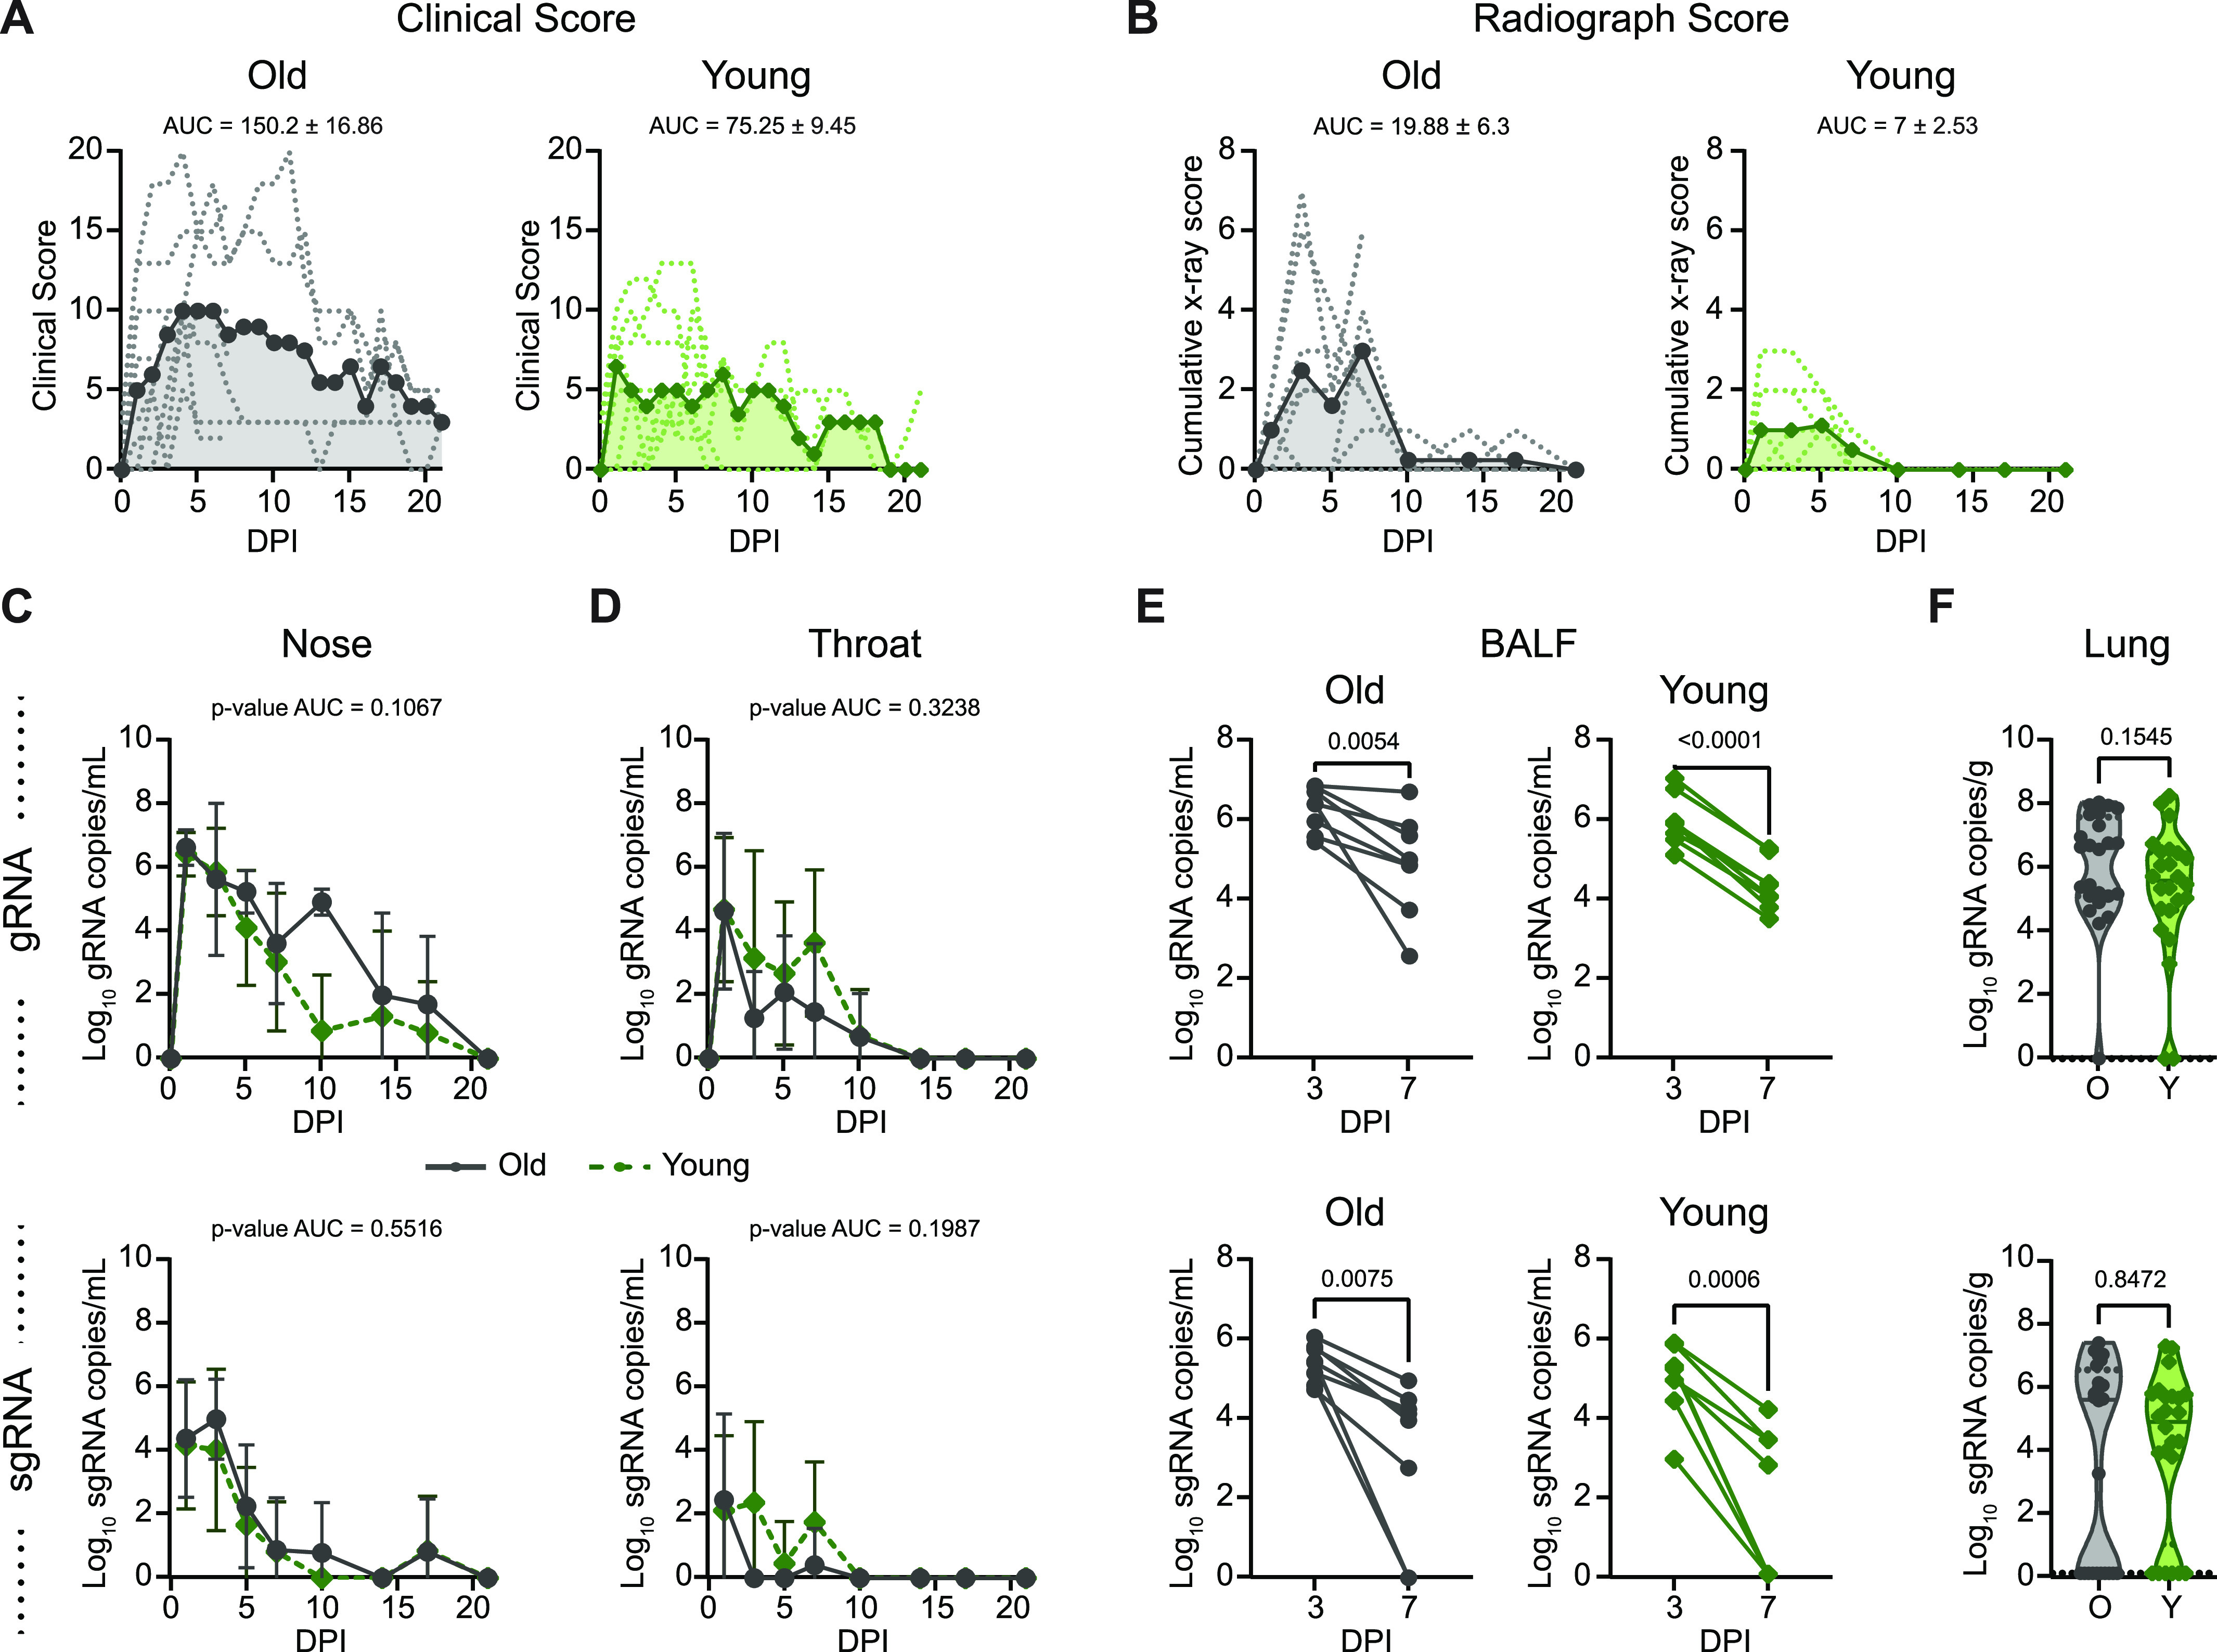
Figure 2. Comparison of clinical and virological outcomes after SARS-CoV-2 inoculation.

(A) Comparison of clinical scores (y-axis) over the time course of infection (x-axis). Data from individual animals are indicated by dashed lines, group means are shown using solid lines, and the area under the curve is represented by shading. (B) Ventro-dorsal and lateral radiographs were taken on clinical examination days and scored for the presence of pulmonary infiltrates by a clinical veterinarian according to a standardized scoring system. (A) Individual lobes were scored and scores per animal per day were totaled and displayed in the same format as panel (A). (C) Genomic RNA (gRNA, top) and subgenomic RNA (sgRNA, bottom) detected in nasal swabs after inoculation. Data points indicate the geometric mean; error bars represent SD. (D) gRNA and sgRNA quantification in throat swabs. (E) gRNA and sgRNA quantification in BALF. Matched values for individual animals at 3 and 7 days post inoculation are indicated by a connecting line. (F) gRNA and sgRNA quantification in lung samples collected at 7 days post inoculation. Points represent a single lung lobe section in an individual animal. Grey represents older (O) and green represents younger (Y) rhesus macaques. (C, D, E, F) P-values were calculated using an unpaired t test comparing the area under the curve values (C, D), paired t test (E), or Mann–Whiney U test (F).
