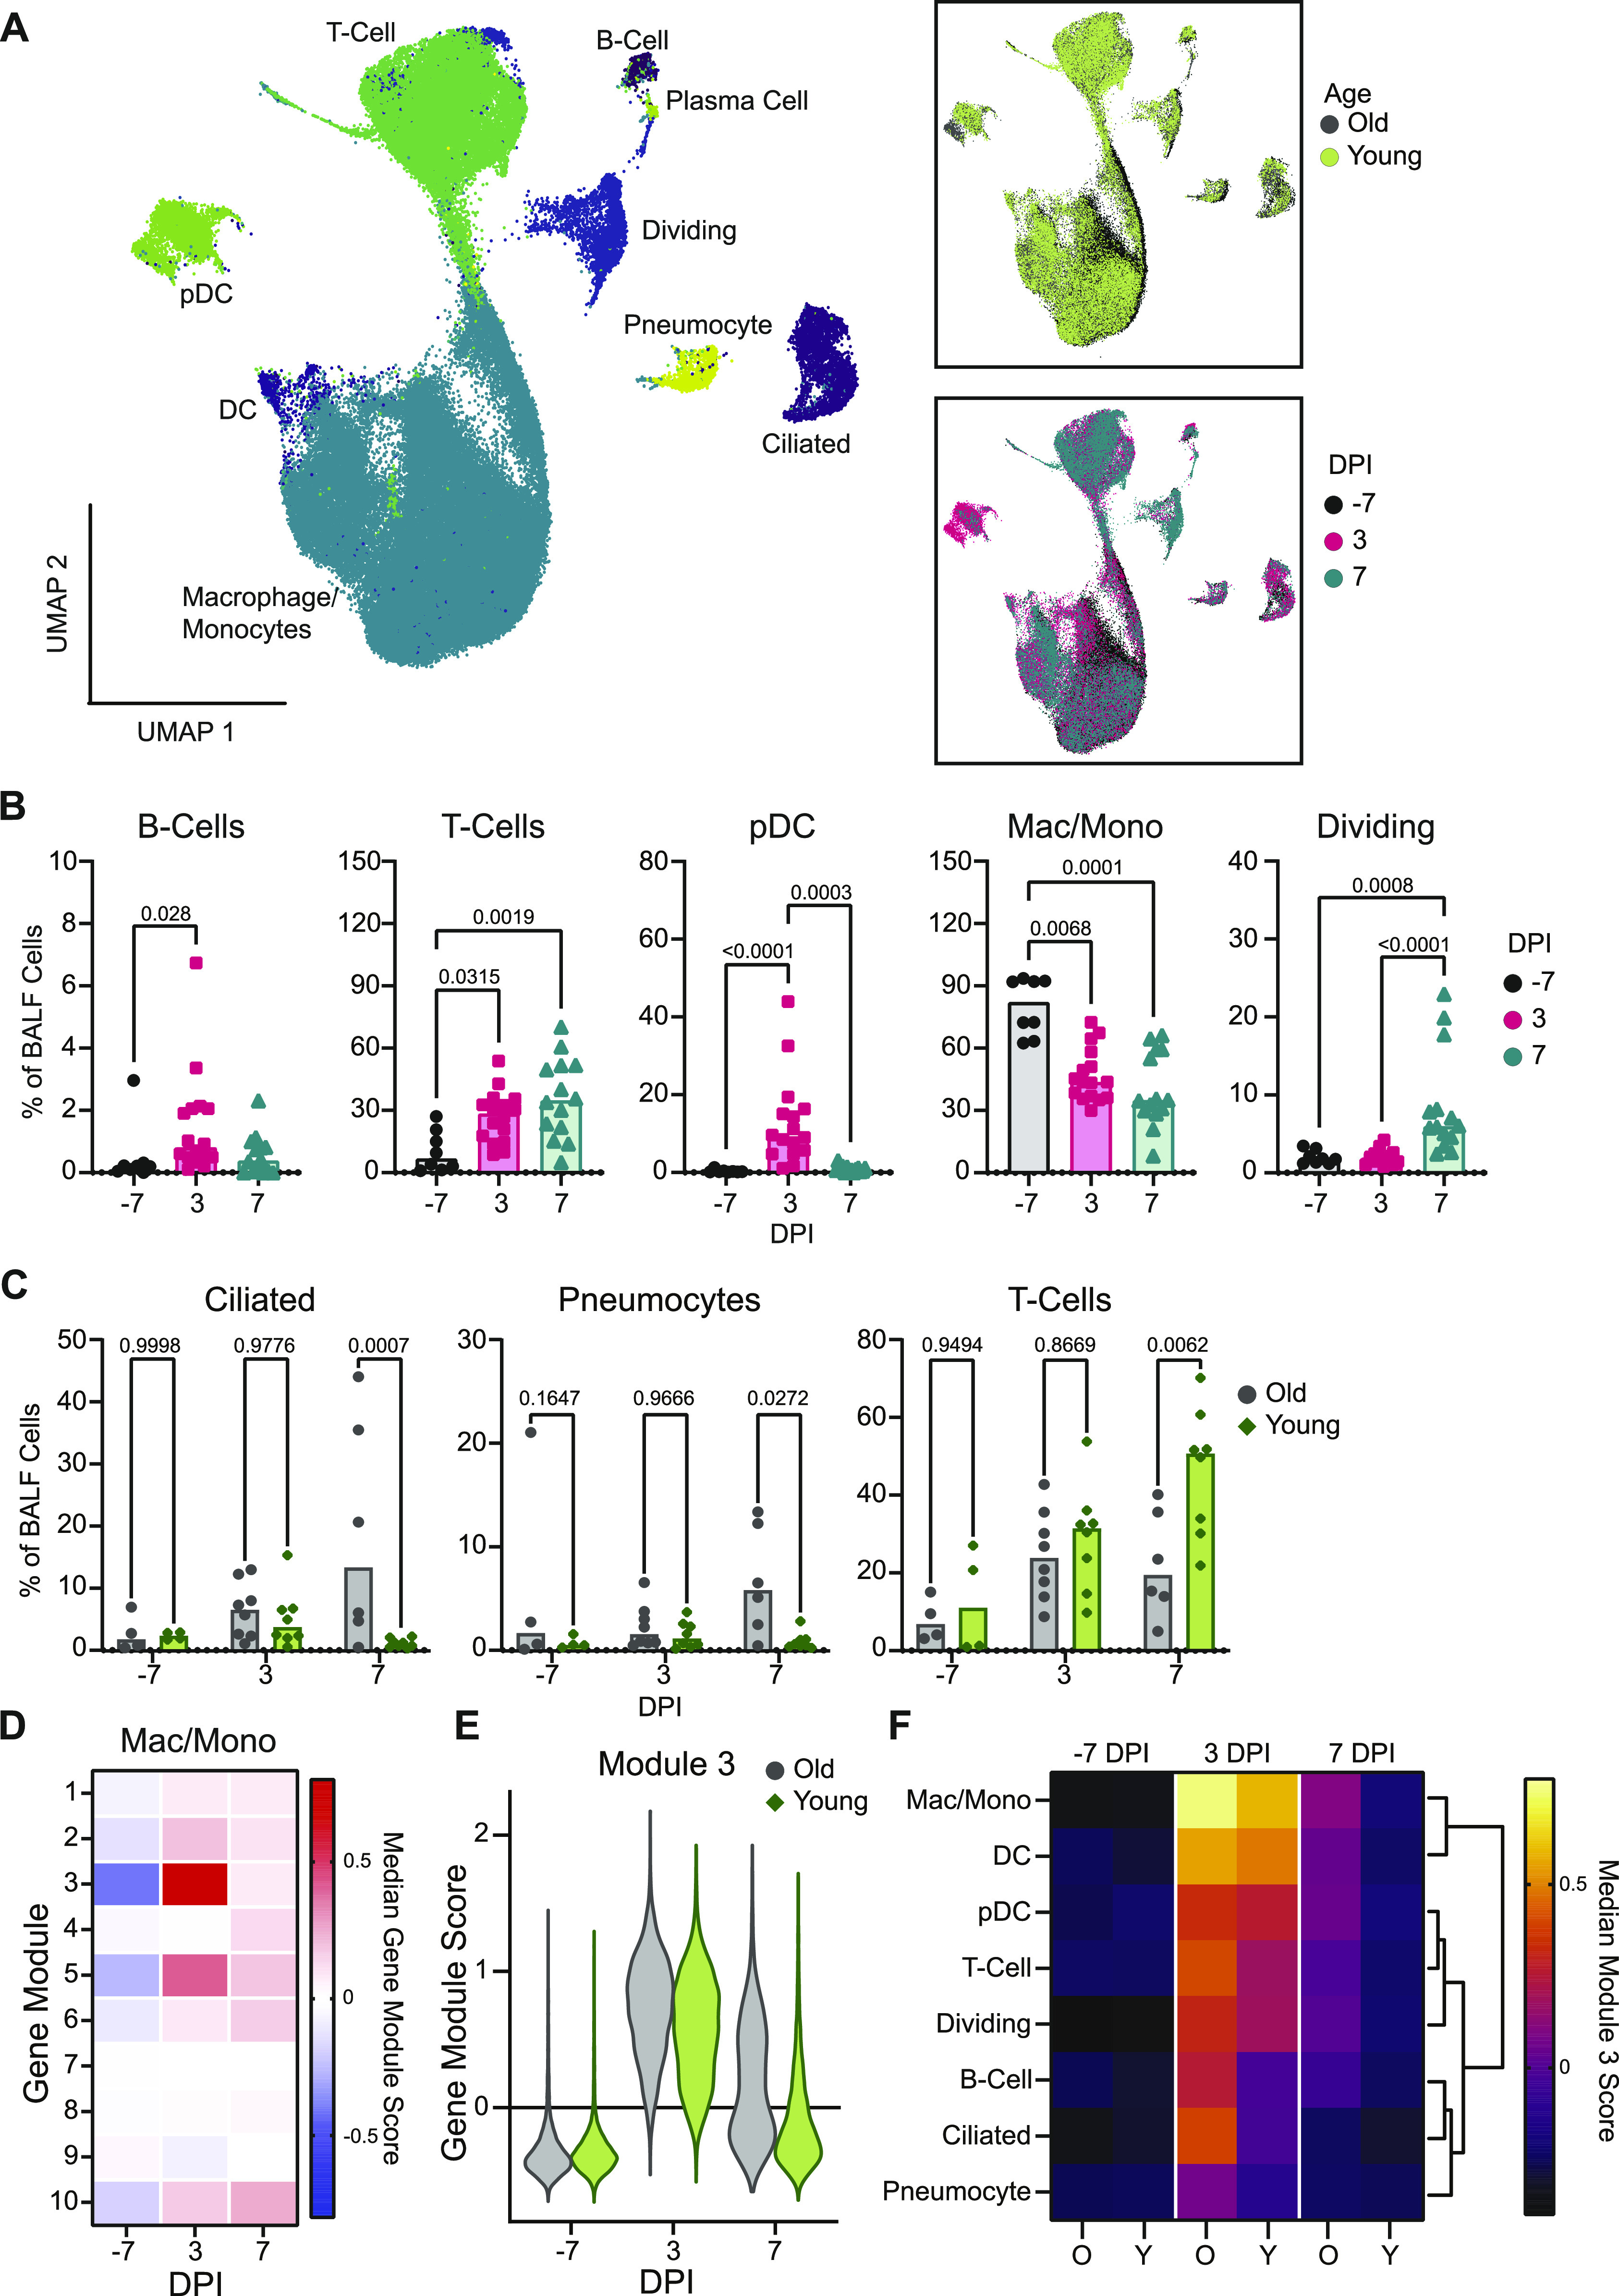
Figure 3. Single-cell sequencing of BALF shows evidence of sustained inflammation in older rhesus macaques.

(A) Uniform manifold approximation projection (UMAP) of single-cell RNA sequencing from BALF. Each point is an individual cell colored by cell type (left), age (top right), or sampling day post inoculation (dpi; bottom right). (B) Cell frequencies as a fraction of total BALF cells for individual animals over the course of infection for B cells, T cells, pDCs, macrophages/monocytes (mac/mono), and dividing cells. Bars represent the median for each time point. P-values are calculated in a two-way ANOVA. All P-values < 0.1 are shown. (C) Cell frequencies as a fraction of total BALF cells for individual animals over time separated by age-group for T cells, pneumocytes, and ciliated cells. Bars represent the mean for each group. P-values are calculated in a two-way ANOVA and all P-values are shown. (D) Heat map of the median gene module scaled expression value for the 10 computationally determined gene modules over the course of infection in macrophage/monocyte cells independent of age-group. Blue colors represent low expression and pink colors represent high expression values. (E) Gene module score for gene module 3 for individual cells over the course of infection in the macrophages/monocytes separated by age-group. (F) Median gene module score for gene module 3 over the course of infection separated by age-group (O: older animals; Y: younger animals), across all cell types. The brighter the color, the higher the expression value. Columns are grouped by dpi and rows are clustered based on Euclidian distance (dendrogram right).
