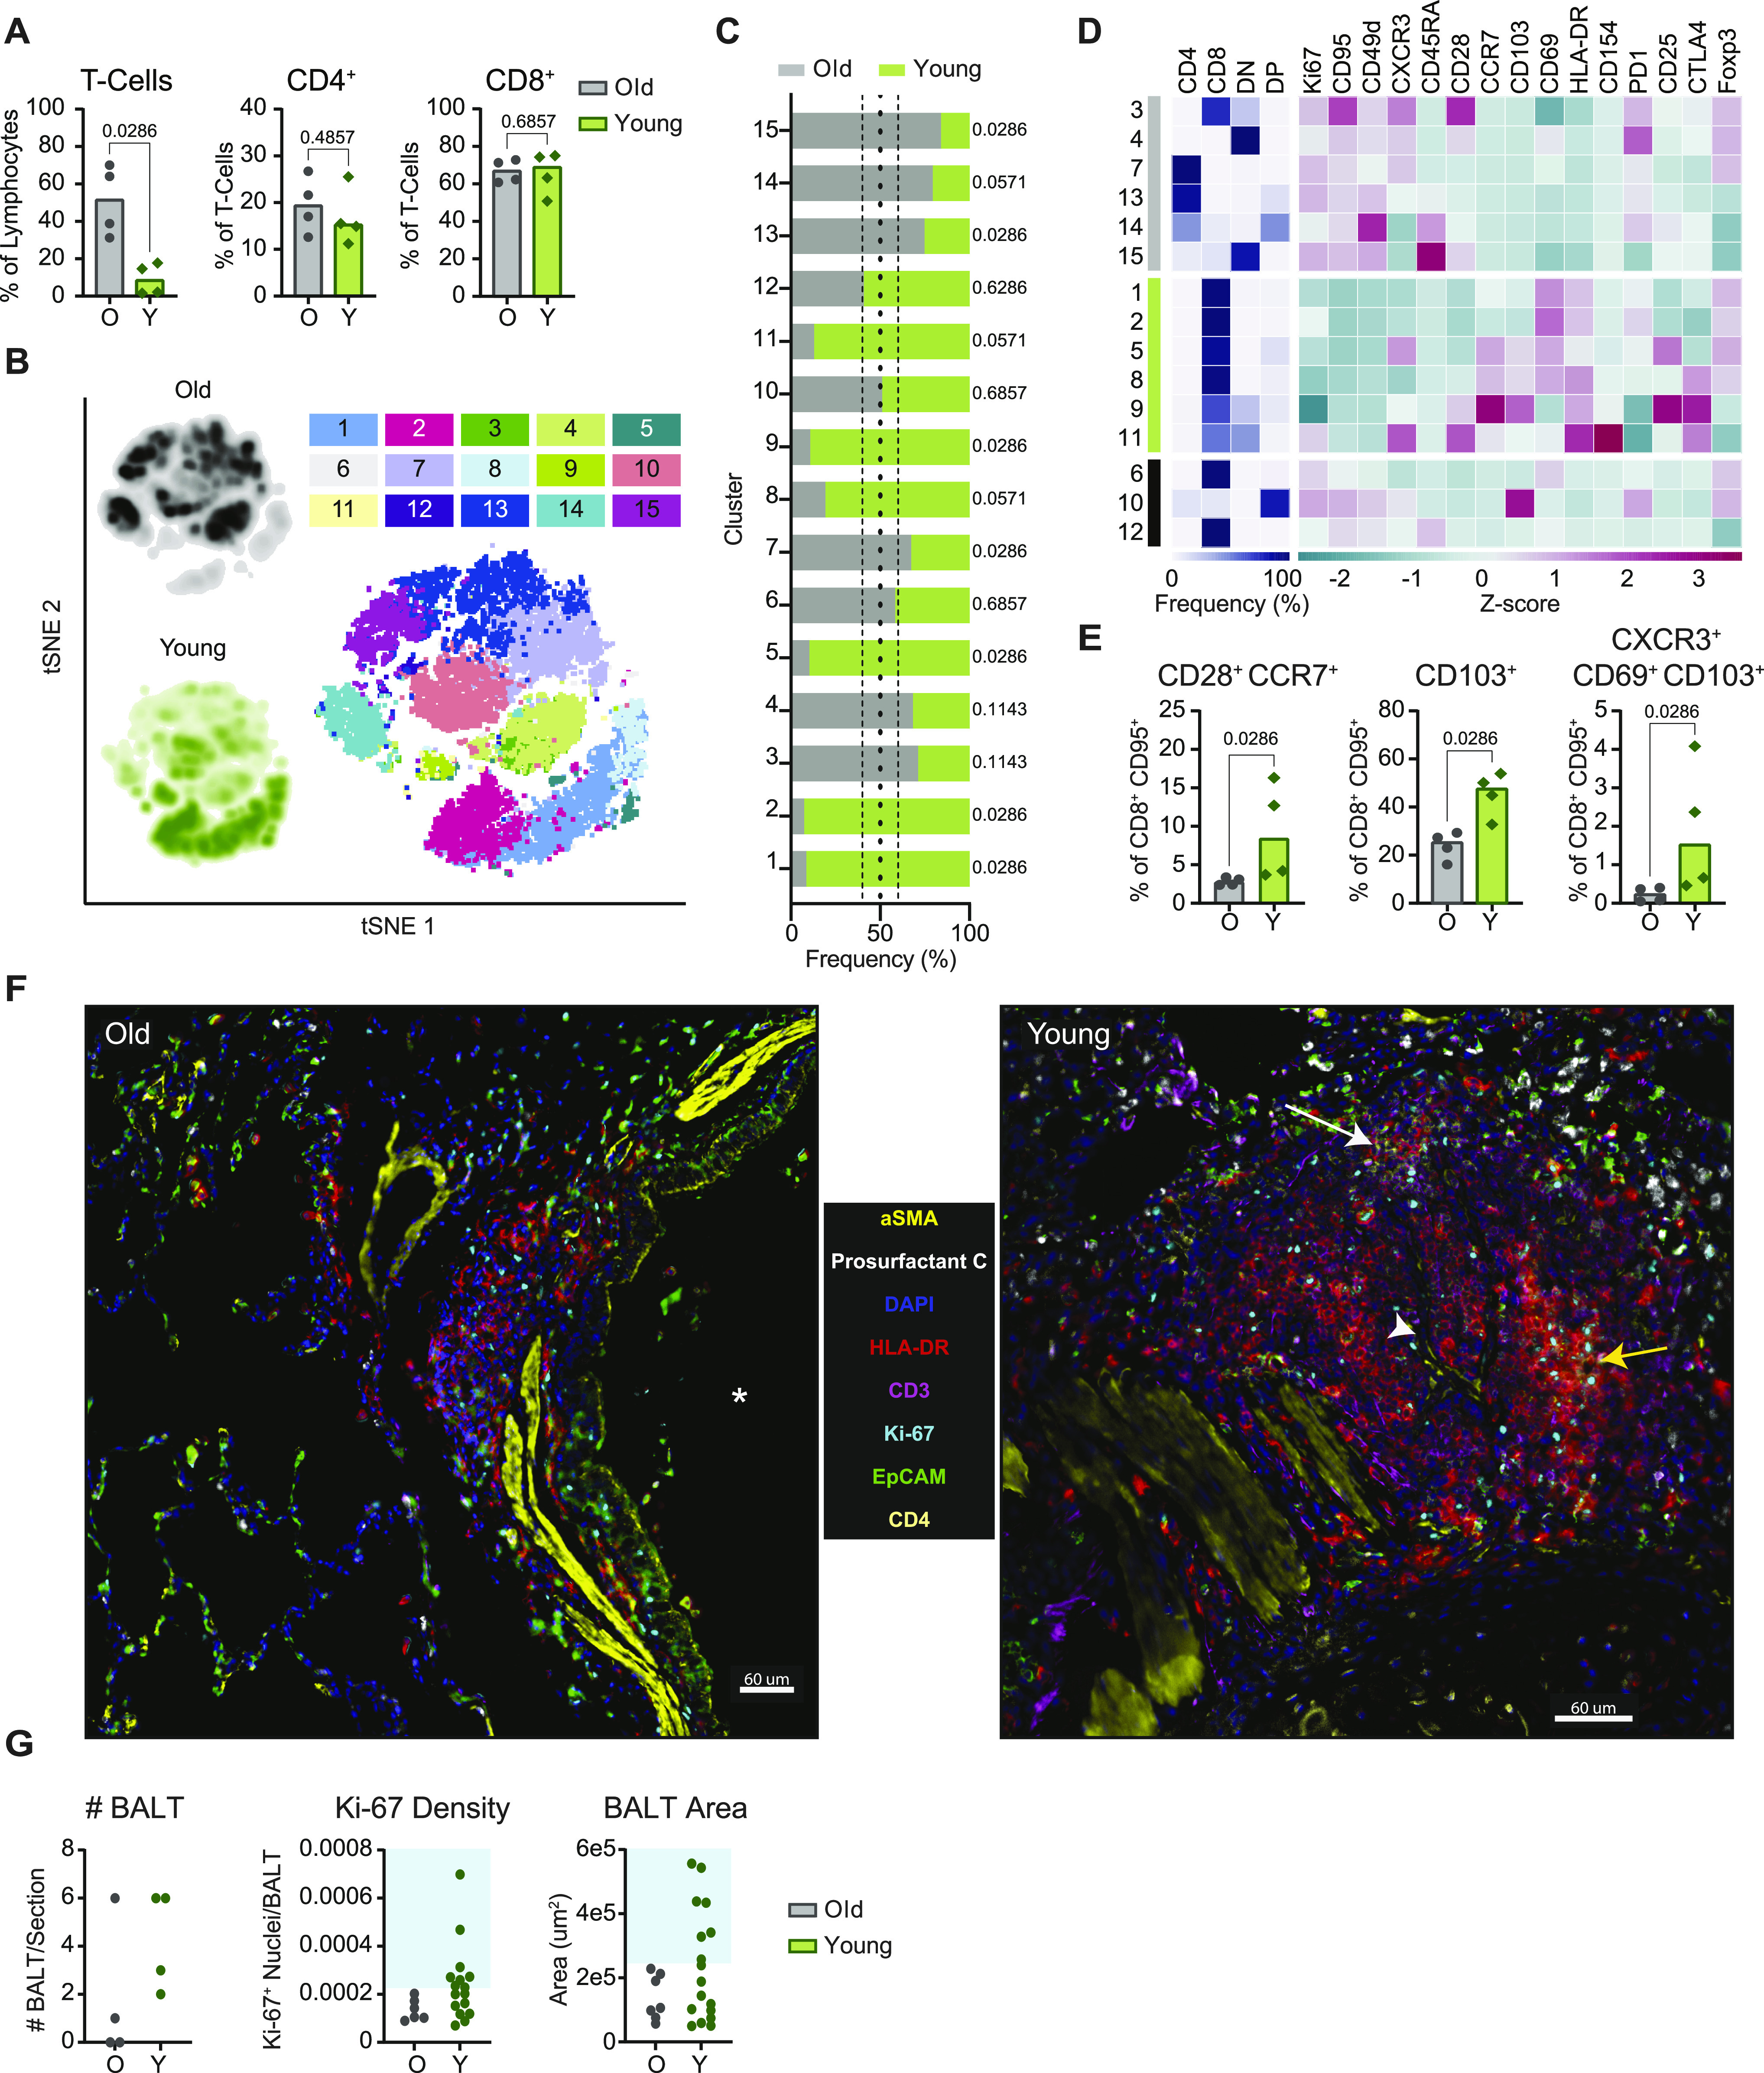
Figure 5. Age-related differences in T-cell memory–associated phenotypes and lymphoid tissue formation are apparent in the lungs at 21 dpi.

(A) Flow cytometric evaluation of single cell suspensions from lung tissue collected at 21 dpi. Frequencies of CD3+ T cells as a percentage of lymphocytes, and frequencies of CD4+ and CD8+ T cells as proportions of CD3+ T cells are shown. Bars depict median frequencies. P-values are calculated using Mann–Whiney U tests. (B) Data visualization by t-SNE analysis and depiction of meta-clusters generated by FlowSOM. Density plots (left) show the distribution of T cells derived from each age cohort. Dot plot depicts individually color-coded FlowSOM meta-clusters overlaid onto total combined T cells (right). (C) Stacked bar chart depicting the cumulative proportion of cells from animals of the older or younger cohort comprising each meta-cluster (1–15). Vertical dotted lines represent (from left to right) the threshold of 10% for enrichment of cells from younger animals, equal composition, and threshold of 10% for enrichment of cells from older animals. P-values comparing the median frequency of cells per animal within each cohort are listed to the right of the stacked-bars for each cluster and are calculated using Mann–Whiney U tests. (D) Heat map representation of meta-cluster phenotypes. The clusters enriched for the cells of the older (grey), younger (green), and neither (black) are indicated (leftmost column). The major T-cell subset characterizing each cluster is shown by depicting the frequencies of CD4+, CD8+, double negative (DN), and double positive (DP) T cells composing each cluster (middle), as well as a phenotypic comparison of clusters by calculation of the z-score of the median fluorescence intensity of 15 markers across clusters (right). (E) Frequency of CD8+ T cells exhibiting a lymph node homing memory phenotype (CD28+ CCR7+) as a percentage of non-naïve CD8+ T cells; and frequencies of CD8+ T cells demonstrating phenotypes associated with tissue-residency (from left to right: CD103+ and CXCR3+ CD69+ CD103+) as a percentage of non-naïve CD8+ T cells are shown. Bars depict median frequencies. P-values are calculated using Mann–Whiney U tests. (F) Representative multiplex immunohistochemistry (mIHC) of a region of a lung section from an older (left) and a younger (right) rhesus macaque focusing on identified bronchus-associated lymphoid tissue (BALT); α-smooth muscle actin, prosurfactant C, DAPI, HLA-DR, CD3, Ki-67, EpCAM, and CD4 are shown. Some features of the images are denoted such as a large airway (*), germinal center formation (yellow arrow), high endothelial venule (HEV) (white arrowhead), and CD4+ T-cell accumulation (white arrow). Scale bars represent 60 μm. (G) Quantification of mIHC images in older and younger animals. Graphs show the number of BALT found in the lung section for each animal (left), the density of Ki-67+ nuclei in all identified BALT (middle), and the area of all identified BALT (right). The blue boxes show the cutoffs for immature BALT (outside shaded area) compared with more advanced BALT (inside shaded area). In panels separated by age-group, grey represents older (O) and green represents younger (Y) rhesus macaques.
