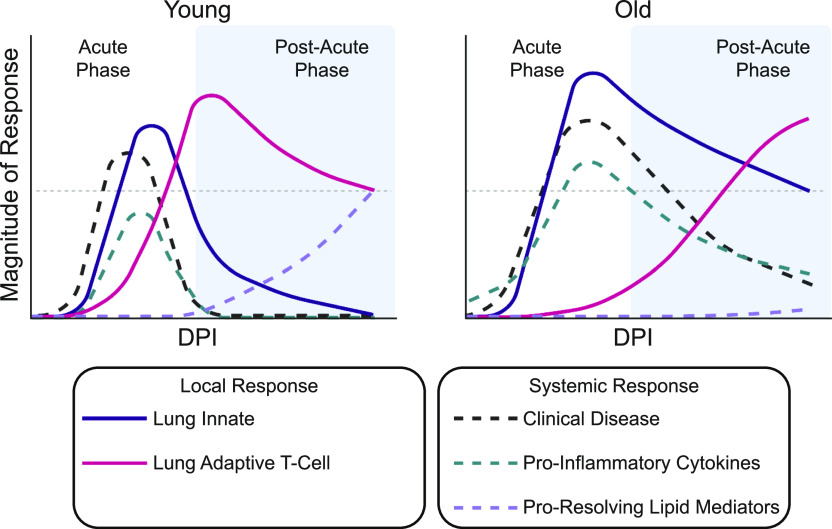
Figure 7. Summary of the immune dynamics in younger and older rhesus macaques during SARS-CoV-2 infection.
Graphical representation of the relative magnitude of response over the course of SARS-CoV-2 infection in younger (left) and older (right) rhesus macaques. The white part of each graph indicates the acute phase of the disease and blue is the post-acute phase. The grey horizontal line is for reference between the two graphs at the same point. The different curves represent different local (lung innate and lung adaptive T cell) and systemic (clinical disease, pro-inflammatory cytokines, and pro-resolving lipid mediators) host responses to SARS-CoV-2 infection.

