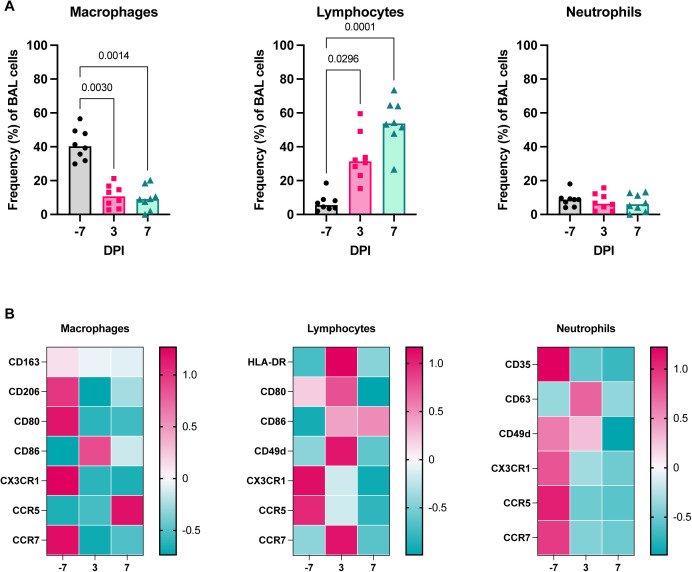
Figure S4. Flow cytometric validation of cell frequencies in BALF during SARS-CoV-2 infection.
(A) Frequency of cells in BALF as determined by flow cytometry for major cell lineages (macrophages, lymphocytes, and neutrophils) over time in one cohort of animals (group necropsied at 7 dpi). P-values are calculated in a two-way ANOVA and only those <0.1 are shown for clarity. (B) Heat maps of the median fluorescence intensity (MFI) of different markers in macrophages (left), lymphocytes (middle), and neutrophils (right) over time. Median fluorescent intensity data are z-normalized across the rows.

