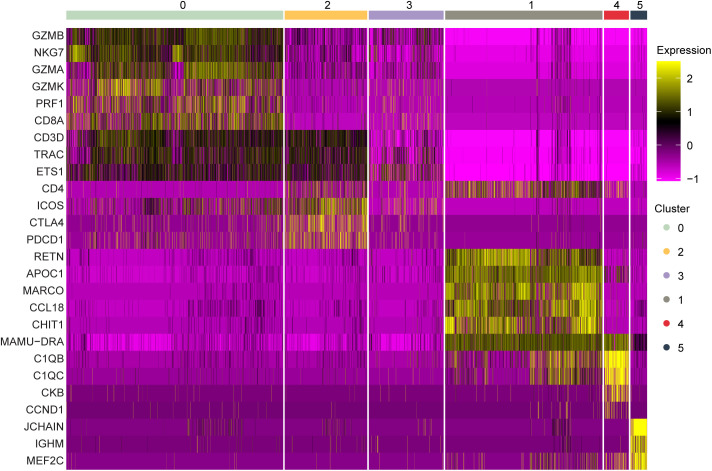
Figure S6. Dividing cell cluster gene expression of marker genes in BALF.
Marker gene expression in individual cells (columns) is shown from the BALF dividing cell cluster. The groups across the top are the Seurat clusters determined by a resolution of 0.2 as shown in Fig 4A. The colors represent the normalized expression of the gene in a given cell with purple representing low to no expression and yellow representing high expression values.

