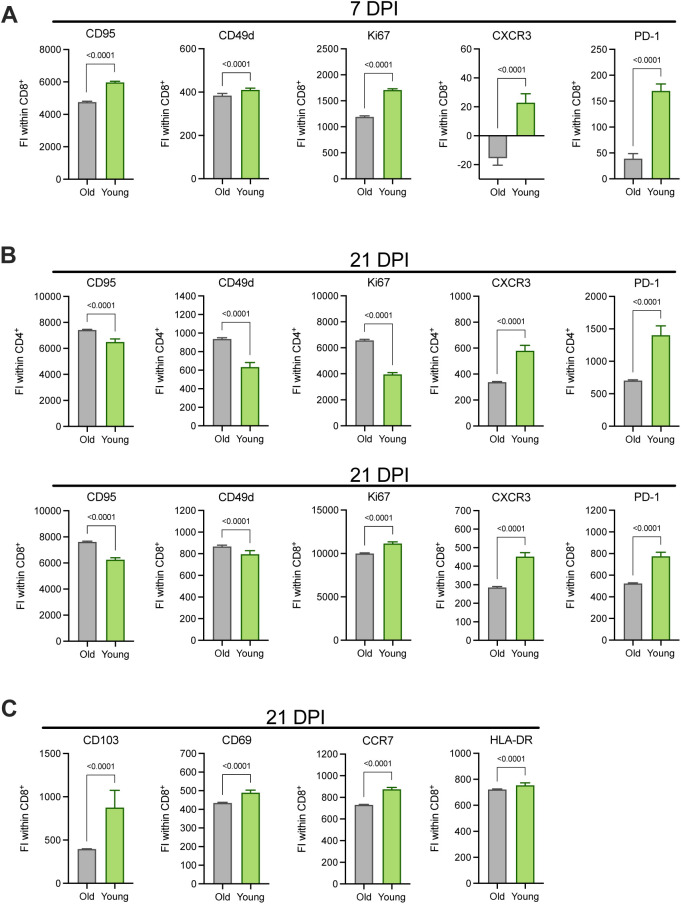
Figure S7. Age-associated expression patterns of markers associated with effector and memory function on CD4+ and CD8+ lung T cells at 7 and 21 DPI.
(A, B, C) The fluorescence intensities (FI) of selected markers stained by flow cytometry on CD8+ T cells at 7 dpi (A), CD4+ (top), and CD8+ (bottom) T cells at 21 dpi (B), and CD8+ T cells at 21 dpi (C) were compared between older and younger rhesus macaques. Bars depict the median and 95% CI calculated across FI values generated for individual CD4+ and CD8+ T cells; the data from these subsets were concatenated across animals within each cohort. P-values are calculated using Mann–Whiney U tests.

