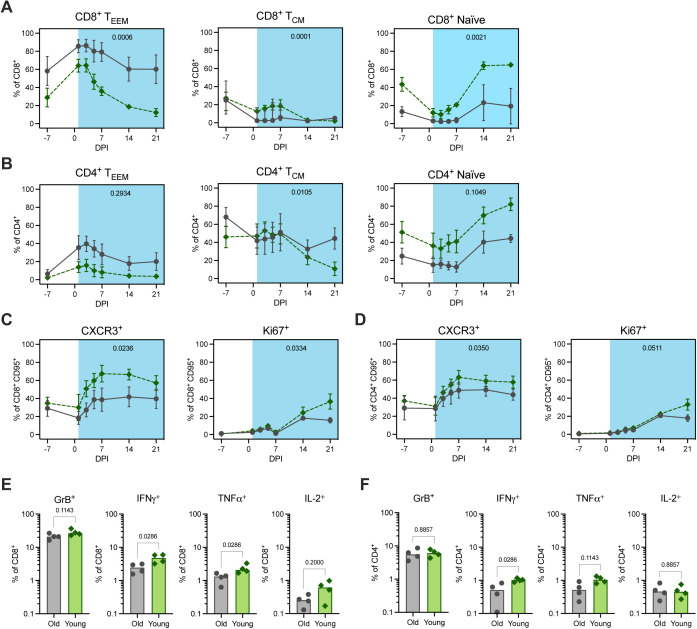
Figure S9. Circulating and splenic T-cell responses post inoculation.
(A, B) Frequencies of effector and effector memory (TEEM, left), central memory (TCM, middle), and naïve (right) CD8+ (A) and CD4+ (B) T cells are shown over time (dpi) as a percentage of total CD8+ and CD4+ T cells, respectively. (C, D) Frequencies of CXCR3+ (left) and Ki67+ (right) populations are shown over time (dpi) as a percentage of CD8+ (C) and CD4+ (D) non-naïve (CD95+) T cells. Data points represent the mean frequencies with SD (error bars) connected across time points for the older (grey circle, solid line) and younger (green diamond, dashed line) rhesus macaques. Area under the curve of frequencies from 1 to 21 dpi was compared between the age cohorts by unpaired t test and P-values are indicated on the graphs. (E, F) The percentage of splenic CD8+ (E) and CD4+ (F) T cells expressing (from left to right) Granzyme B (GrB), IFNγ, TNFα, and IL-2, after SAR-CoV-2 spike protein-peptide pool stimulation and intracellular cytokine staining. All bars depict group medians; P-values are the result of Mann–Whiney U tests.

