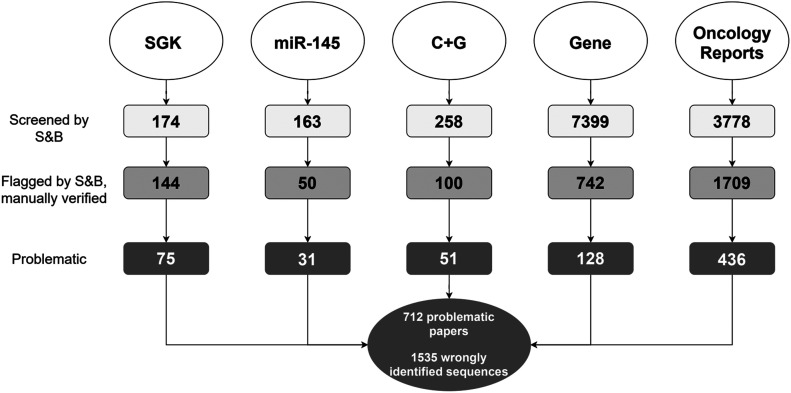
Figure 1. Diagram describing the five literature corpora screened by S&B.
For each corpus (top row), the diagram shows the numbers of articles that were (i) screened by S&B (white), (ii) flagged by S&B with sequences manually verified (grey), and (iii) found to be problematic by describing at least one wrongly identified nucleotide sequence (dark grey). Total numbers of problematic articles and wrongly identified sequences are indicated below the diagram, corrected for duplicate articles between the corpora.

