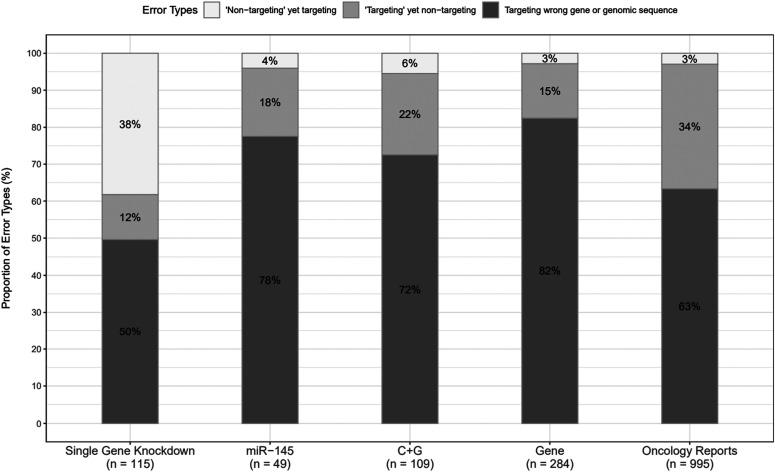
Figure 2. Percentages of sequence identity error types in each corpus.
Percentages of wrongly identified nucleotide sequence reagents that correspond to the three identity error types (y-axis) in each corpus (x-axis). Percentages corresponding to each error type are indicated, rounded to the nearest single digit. The numbers of incorrect sequences in each corpus are shown below the x-axis.

