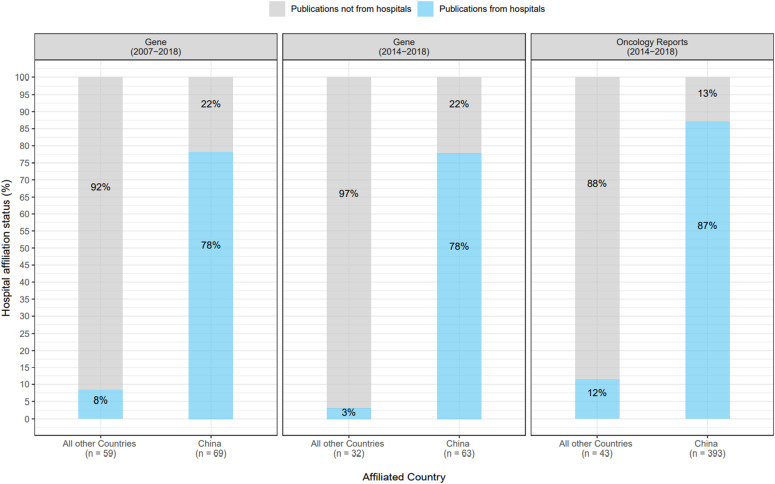
Figure 4. Percentages of problematic Gene and Oncology Reports articles according to hospital affiliation status and country of origin.
Percentages of problematic Gene and Oncology Reports articles according to hospital affiliation status (y-axis) from either China or all other countries (x-axis). The journal and relevant date ranges of problematic articles are shown above each panel. Problematic articles that were (not) affiliated with hospitals are shown in blue (grey), respectively. Percentages shown have been rounded to the nearest single digit. Numbers of problematic articles from China or all other countries are indicated below the x-axis. For the comparisons shown in each panel, significantly higher proportions of problematic articles from China were affiliated with hospitals versus problematic articles from other countries (Fisher’s Exact test, P < 0.001).

