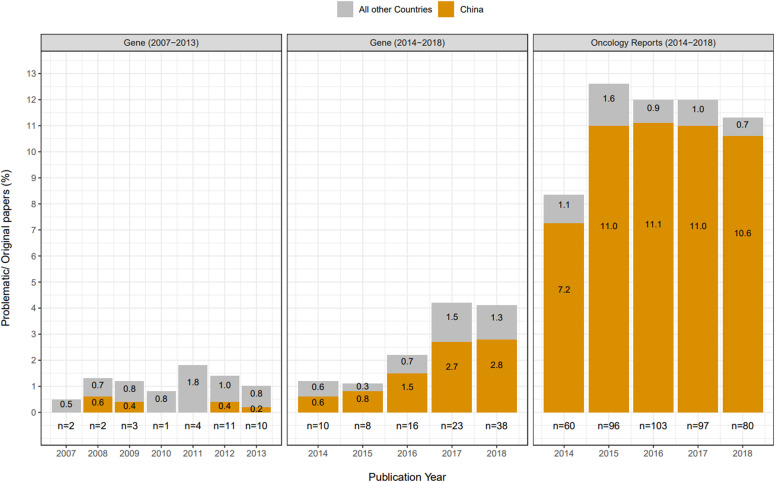
Figure 5. Percentages and numbers of problematic Gene and Oncology Reports articles per year.
Percentages of all Gene or Oncology Reports articles that were found to be problematic (y-axis) per publication year (x-axis). The journal and relevant publication year ranges are shown above each panel. Problematic articles from China or all other countries are shown in orange or grey, respectively. Percentages shown are rounded to one decimal place. Total numbers of problematic articles per year are shown below each graph.

