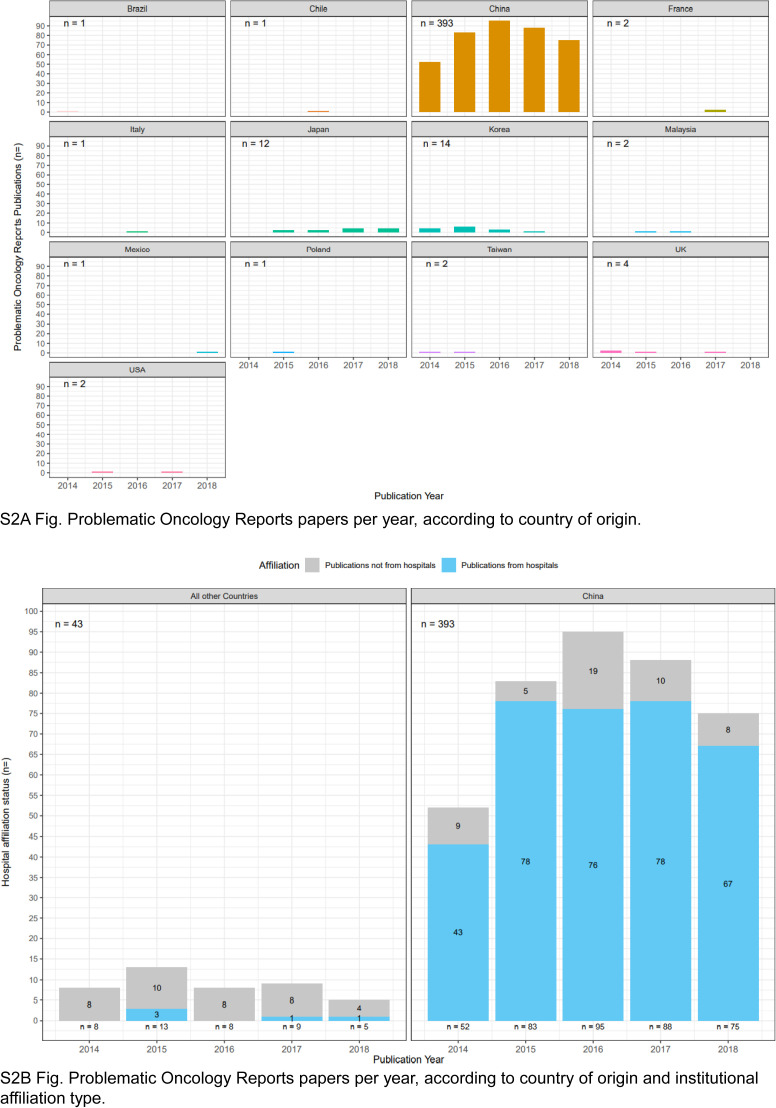
Figure S2. Problematic Oncology Reports articles per year, according to country of origin and institutional affiliation type.
Total numbers of problematic articles for each country/group of countries are shown in the upper left corner of each panel. (A) Numbers of problematic Oncology Reports articles (y-axes) per publication year (x-axes) according to country of origin, shown above each graph. Countries are shown in alphabetical order, from top left. (B) Numbers of problematic Oncology Reports articles (y-axis) per publication year (x-axis) from China (right panel) or all other countries (left panel). Articles affiliated with hospitals or other institution types are shown in blue or grey, respectively. Numbers of problematic articles per year are shown below each stacked bar graph.

